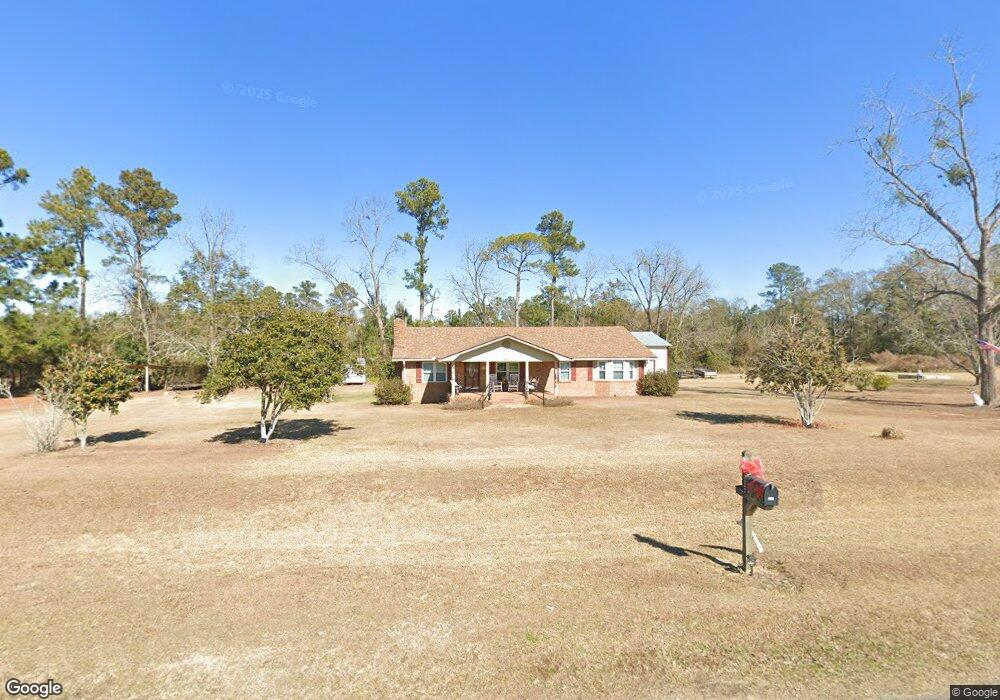
310 Whigham Rd Whigham, GA 39897
Estimated Value: $239,767 - $305,000
2
Beds
2
Baths
1,890
Sq Ft
$150/Sq Ft
Est. Value
About This Home
This home is located at 310 Whigham Rd, Whigham, GA 39897 and is currently estimated at $284,192, approximately $150 per square foot. 310 Whigham Rd is a home located in Grady County.
Ownership History
Date
Name
Owned For
Owner Type
Purchase Details
Closed on
Jul 31, 2012
Sold by
Harrison Lois
Bought by
Sellars Cathy H
Current Estimated Value
Purchase Details
Closed on
Apr 26, 1977
Bought by
Harrison Lois
Create a Home Valuation Report for This Property
The Home Valuation Report is an in-depth analysis detailing your home's value as well as a comparison with similar homes in the area
Home Values in the Area
Average Home Value in this Area
Purchase History
| Date | Buyer | Sale Price | Title Company |
|---|---|---|---|
| Sellars Cathy H | -- | -- | |
| Harrison Boykin Lee | -- | -- | |
| Harrison Lois | -- | -- |
Source: Public Records
Tax History Compared to Growth
Tax History
| Year | Tax Paid | Tax Assessment Tax Assessment Total Assessment is a certain percentage of the fair market value that is determined by local assessors to be the total taxable value of land and additions on the property. | Land | Improvement |
|---|---|---|---|---|
| 2024 | $2,675 | $88,940 | $7,112 | $81,828 |
| 2023 | $1,297 | $44,132 | $4,562 | $39,570 |
| 2022 | $1,297 | $44,132 | $4,562 | $39,570 |
| 2021 | $1,039 | $35,654 | $4,562 | $31,092 |
| 2020 | $997 | $34,170 | $4,562 | $29,608 |
| 2019 | $997 | $34,170 | $4,562 | $29,608 |
| 2018 | $936 | $31,274 | $4,562 | $26,712 |
| 2017 | $866 | $31,274 | $4,562 | $26,712 |
| 2016 | $700 | $27,126 | $4,562 | $22,564 |
| 2015 | $690 | $27,126 | $4,562 | $22,564 |
| 2014 | $690 | $27,126 | $4,562 | $22,564 |
| 2013 | -- | $24,624 | $4,428 | $20,196 |
Source: Public Records
Map
Nearby Homes
- 0 Harrell Rd
- 53 +/- A Bond Rd
- 189 Sabino Dr
- 1741 Georgia 112
- 000 Noles Rd
- 7268 Lodgetown Rd
- 2033 Old 179 N
- 231 Mcintyre Ln
- 0 Wade Rd
- 1067 Wade Rd
- 835 Mill Pond Rd
- 0 Cal Thomas Rd
- TBD3 Cumbie Rd
- TBD2 Cumbie Rd
- TBD4 Cumbie Rd
- Tbd Cumbie Rd
- 0 Cumbie Rd
- 264 Woodridge Ln
- 6203 Mount Olive Rd
- 158 Woodridge Ln