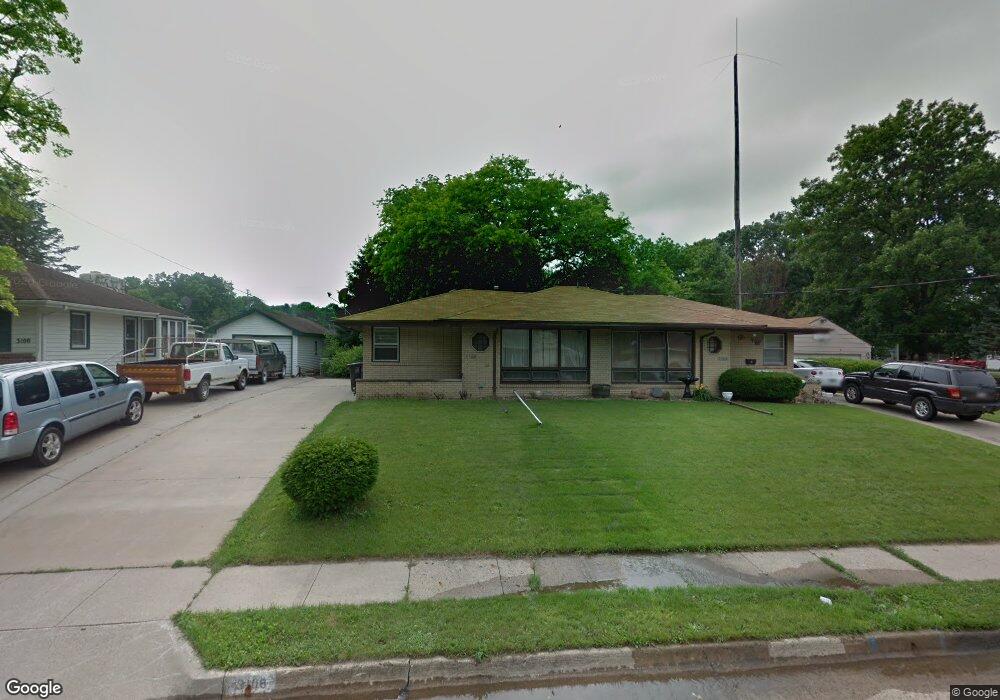
3106 Roblang Ct Des Moines, IA 50317
Fairmont Park NeighborhoodEstimated Value: $230,078 - $255,000
4
Beds
2
Baths
1,504
Sq Ft
$160/Sq Ft
Est. Value
About This Home
This home is located at 3106 Roblang Ct, Des Moines, IA 50317 and is currently estimated at $240,270, approximately $159 per square foot. 3106 Roblang Ct is a home located in Polk County with nearby schools including Garton Elementary School, Goodrell Middle School, and North High School.
Ownership History
Date
Name
Owned For
Owner Type
Purchase Details
Closed on
Aug 14, 2014
Sold by
Shaw Margaret and Buch Margaret
Bought by
Bryant Family Trust and Bryant Ginelle A
Current Estimated Value
Purchase Details
Closed on
Mar 31, 2014
Sold by
Shaw Matthew D
Bought by
Bryant Joseph
Home Financials for this Owner
Home Financials are based on the most recent Mortgage that was taken out on this home.
Original Mortgage
$91,000
Interest Rate
3.31%
Mortgage Type
New Conventional
Purchase Details
Closed on
Dec 27, 2002
Sold by
Elder Judith Ann and Elder Jared R
Bought by
Shaw Matthew D
Home Financials for this Owner
Home Financials are based on the most recent Mortgage that was taken out on this home.
Original Mortgage
$116,850
Interest Rate
6.01%
Create a Home Valuation Report for This Property
The Home Valuation Report is an in-depth analysis detailing your home's value as well as a comparison with similar homes in the area
Home Values in the Area
Average Home Value in this Area
Purchase History
| Date | Buyer | Sale Price | Title Company |
|---|---|---|---|
| Bryant Family Trust | -- | None Available | |
| Bryant Joseph | $130,000 | None Available | |
| Shaw Matthew D | $122,500 | -- |
Source: Public Records
Mortgage History
| Date | Status | Borrower | Loan Amount |
|---|---|---|---|
| Open | Delta Property Management Llc | $120,400 | |
| Open | Delta Property Management Llc | $180,000 | |
| Closed | Bryant Joseph | $91,000 | |
| Previous Owner | Shaw Matthew | $131,750 | |
| Previous Owner | Shaw Matthew D | $116,850 |
Source: Public Records
Tax History Compared to Growth
Tax History
| Year | Tax Paid | Tax Assessment Tax Assessment Total Assessment is a certain percentage of the fair market value that is determined by local assessors to be the total taxable value of land and additions on the property. | Land | Improvement |
|---|---|---|---|---|
| 2024 | $4,008 | $203,700 | $21,100 | $182,600 |
| 2023 | $3,792 | $203,700 | $21,100 | $182,600 |
| 2022 | $3,764 | $160,900 | $17,400 | $143,500 |
| 2021 | $3,756 | $160,900 | $17,400 | $143,500 |
| 2020 | $3,902 | $150,500 | $16,200 | $134,300 |
| 2019 | $3,658 | $150,500 | $16,200 | $134,300 |
| 2018 | $3,620 | $136,100 | $14,300 | $121,800 |
| 2017 | $3,452 | $136,100 | $14,300 | $121,800 |
| 2016 | $3,362 | $127,600 | $13,200 | $114,400 |
| 2015 | $3,362 | $127,600 | $13,200 | $114,400 |
| 2014 | $3,204 | $120,600 | $12,300 | $108,300 |
Source: Public Records
Map
Nearby Homes
- 3101 Roblang Ct
- 2936 E Tiffin Ave
- 3005 Don Lee Ct
- 2817 Richmond Ave
- 2807 Richmond Ave
- 2722 E Tiffin Ave
- 2719 E Tiffin Ave
- 3223 Hull Ave
- 2704 Wedgewood Rd
- 3520 E 32nd St
- 2616 Hull Ave
- 3218 E 26th St
- 2633 Grandview Ave
- 3019 E Douglas Ave
- 3025 E Douglas Ave
- 2608 Grandview Ave
- 3811 E 30th St
- 2800 E Douglas Ave
- 3819 E 32nd St
- 2560 E Sheridan Ave
- 3106 & 3108 Roblang Ct
- 3100 Roblang Ct
- 2939 E Tiffin Ave
- 2931 E Tiffin Ave
- 3024 Roblang Ct
- 3107 Roblang Ct
- 3113 Roblang Ct
- 3020 Roblang Ct
- 3027 Roblang Ct
- 2921 E Tiffin Ave
- 2945 E Tiffin Ave
- 3021 Roblang Ct
- 3014 Roblang Ct
- 2951 E Tiffin Ave
- 3104 Don Lee Ct
- 3108 Don Lee Ct
- 2915 E Tiffin Ave
- 3100 Don Lee Ct
- 3015 Roblang Ct
- 3010 Don Lee Ct