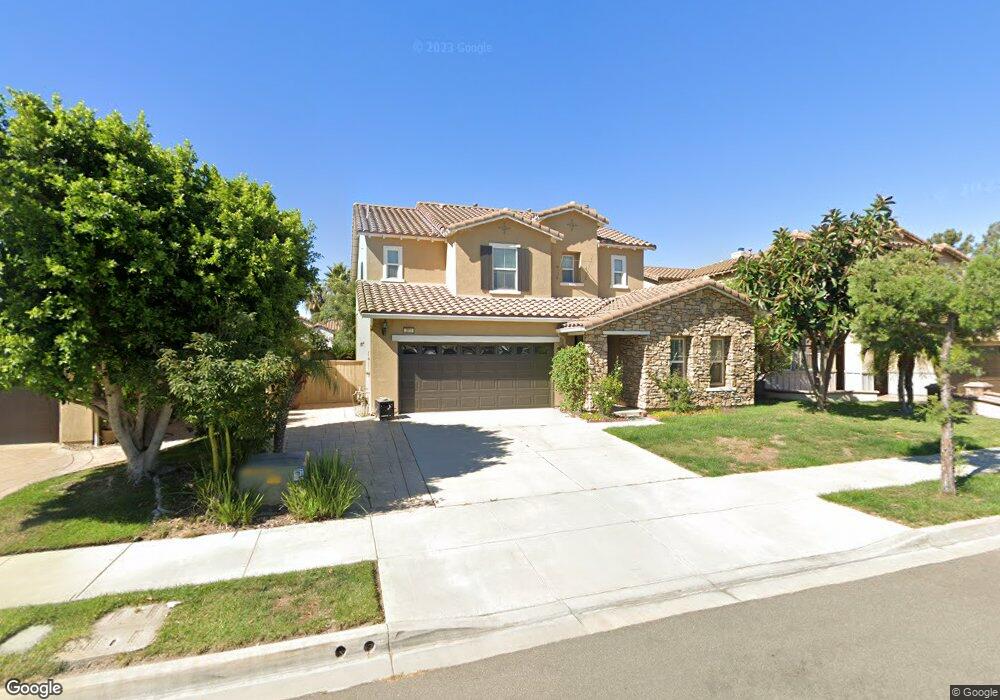
311 Commons Park Dr Camarillo, CA 93012
Estimated Value: $1,156,000 - $1,346,000
4
Beds
3
Baths
2,806
Sq Ft
$452/Sq Ft
Est. Value
About This Home
This home is located at 311 Commons Park Dr, Camarillo, CA 93012 and is currently estimated at $1,268,064, approximately $451 per square foot. 311 Commons Park Dr is a home located in Ventura County with nearby schools including Rancho Rosal Elementary School, Adolfo Camarillo High School, and St. Mary Magdalen.
Ownership History
Date
Name
Owned For
Owner Type
Purchase Details
Closed on
Feb 23, 2010
Sold by
Rosas Claudio
Bought by
Hua Lei and Huang Jing
Current Estimated Value
Home Financials for this Owner
Home Financials are based on the most recent Mortgage that was taken out on this home.
Original Mortgage
$400,000
Outstanding Balance
$263,538
Interest Rate
4.94%
Mortgage Type
New Conventional
Estimated Equity
$1,004,526
Purchase Details
Closed on
Aug 10, 2005
Sold by
Western Pacific Housing Inc
Bought by
Rosas Claudio
Home Financials for this Owner
Home Financials are based on the most recent Mortgage that was taken out on this home.
Original Mortgage
$69,294
Interest Rate
5.32%
Mortgage Type
Fannie Mae Freddie Mac
Create a Home Valuation Report for This Property
The Home Valuation Report is an in-depth analysis detailing your home's value as well as a comparison with similar homes in the area
Home Values in the Area
Average Home Value in this Area
Purchase History
| Date | Buyer | Sale Price | Title Company |
|---|---|---|---|
| Hua Lei | $585,000 | Fidelity National Title Co | |
| Rosas Claudio | $693,000 | Chicago Title Subdivision |
Source: Public Records
Mortgage History
| Date | Status | Borrower | Loan Amount |
|---|---|---|---|
| Open | Hua Lei | $400,000 | |
| Previous Owner | Rosas Claudio | $69,294 | |
| Previous Owner | Rosas Claudio | $554,352 |
Source: Public Records
Tax History Compared to Growth
Tax History
| Year | Tax Paid | Tax Assessment Tax Assessment Total Assessment is a certain percentage of the fair market value that is determined by local assessors to be the total taxable value of land and additions on the property. | Land | Improvement |
|---|---|---|---|---|
| 2025 | $8,199 | $755,114 | $377,558 | $377,556 |
| 2024 | $8,199 | $740,308 | $370,155 | $370,153 |
| 2023 | $7,903 | $725,793 | $362,897 | $362,896 |
| 2022 | $7,879 | $711,562 | $355,781 | $355,781 |
| 2021 | $7,594 | $697,610 | $348,805 | $348,805 |
| 2020 | $7,566 | $690,458 | $345,229 | $345,229 |
| 2019 | $7,531 | $676,920 | $338,460 | $338,460 |
| 2018 | $7,391 | $663,648 | $331,824 | $331,824 |
| 2017 | $6,954 | $650,636 | $325,318 | $325,318 |
| 2016 | $6,786 | $637,880 | $318,940 | $318,940 |
| 2015 | $6,714 | $628,300 | $314,150 | $314,150 |
| 2014 | $6,556 | $615,996 | $307,998 | $307,998 |
Source: Public Records
Map
Nearby Homes
- 428 Twilight Ct
- 167 Westpark Ct Unit 102
- 409 Spring Park Rd
- 3367 Shadetree Way
- 3343 Shadetree Way
- 3548 Bridgehampton Way
- 62 + Calleguas
- 2864 Via Dolomito
- 2870 Via Dolomito
- 586 Via Chelsea
- 120 Palm Dr
- 591 Via Chelsea
- 167 Bellafonte Ct
- 95 Camino Algarve Unit 95
- 94 Camino Algarve
- 89 Via Gabilan
- 48 Via Lisboa Unit 48
- 31 Via Paloma
- 143 Flora Vista Ave
- 478 Staunton St
- 317 Commons Park Dr
- 309 Commons Park Dr
- 303 Commons Park Dr
- 319 Commons Park Dr
- 321 Commons Park Dr
- 314 Commons Park Dr
- 320 Commons Park Dr
- 306 Castleton St
- 308 Westpark Ct
- 325 Commons Park Dr
- 322 Commons Park Dr
- 318 Castleton St
- 328 Commons Park Dr
- 329 Castleton St
- 327 Commons Park Dr
- 328 Castleton St
- 358 Cottages Ct
- 329 Commons Park Dr
- 347 Castleton St
- 338 Castleton St