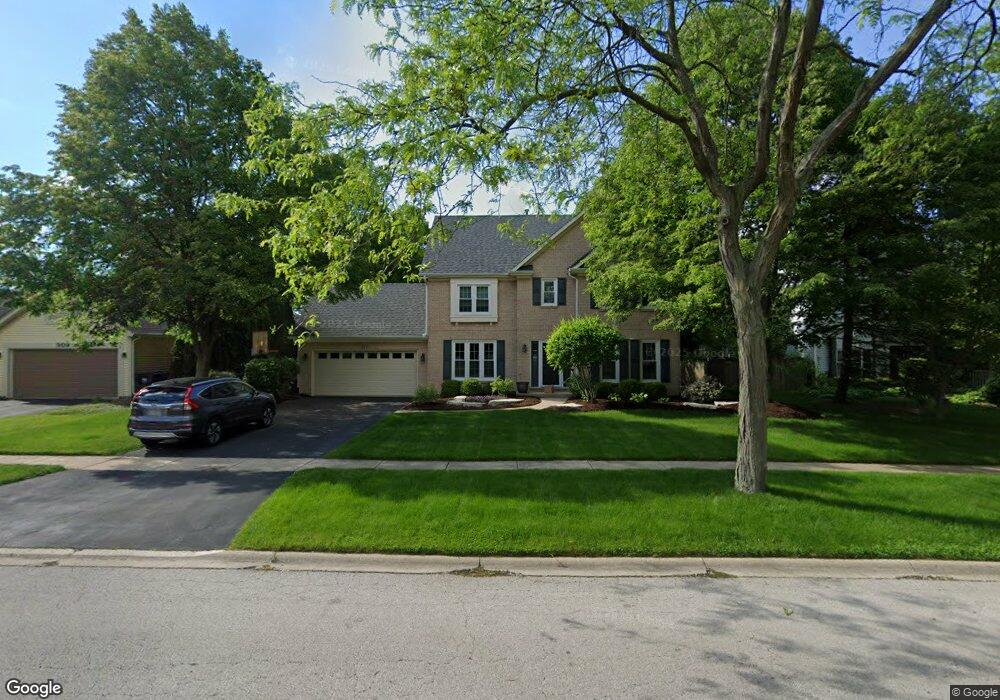
311 Lombardy Ln Oswego, IL 60543
North Oswego NeighborhoodEstimated Value: $438,977 - $458,000
4
Beds
3
Baths
2,130
Sq Ft
$211/Sq Ft
Est. Value
About This Home
This home is located at 311 Lombardy Ln, Oswego, IL 60543 and is currently estimated at $449,244, approximately $210 per square foot. 311 Lombardy Ln is a home located in Kendall County with nearby schools including Old Post Elementary School, Thompson Jr. High School, and Oswego High School.
Ownership History
Date
Name
Owned For
Owner Type
Purchase Details
Closed on
Oct 14, 2024
Sold by
Blocker Douglas M and Blocker Susan M
Bought by
Douglas M Blocker Trust and Susan M Blocker Trust
Current Estimated Value
Purchase Details
Closed on
May 13, 2004
Sold by
Valbert Jay L and Valbert Rebecca L
Bought by
Blocker Douglas M and Blocker Susan M
Home Financials for this Owner
Home Financials are based on the most recent Mortgage that was taken out on this home.
Original Mortgage
$224,800
Interest Rate
5.99%
Mortgage Type
Purchase Money Mortgage
Purchase Details
Closed on
Jul 1, 1995
Bought by
Valbert Jay L & Rebecca L
Purchase Details
Closed on
Jan 20, 1993
Bought by
Moore Merle and Moore Iris
Create a Home Valuation Report for This Property
The Home Valuation Report is an in-depth analysis detailing your home's value as well as a comparison with similar homes in the area
Home Values in the Area
Average Home Value in this Area
Purchase History
| Date | Buyer | Sale Price | Title Company |
|---|---|---|---|
| Douglas M Blocker Trust | -- | None Listed On Document | |
| Blocker Douglas M | $281,000 | Chicago Title Insurance Comp | |
| Valbert Jay L & Rebecca L | $185,000 | -- | |
| Moore Merle | $182,200 | -- |
Source: Public Records
Mortgage History
| Date | Status | Borrower | Loan Amount |
|---|---|---|---|
| Previous Owner | Blocker Douglas M | $224,800 | |
| Closed | Moore Merle | -- |
Source: Public Records
Tax History Compared to Growth
Tax History
| Year | Tax Paid | Tax Assessment Tax Assessment Total Assessment is a certain percentage of the fair market value that is determined by local assessors to be the total taxable value of land and additions on the property. | Land | Improvement |
|---|---|---|---|---|
| 2024 | $9,718 | $126,763 | $29,804 | $96,959 |
| 2023 | $8,752 | $112,179 | $26,375 | $85,804 |
| 2022 | $8,752 | $102,916 | $24,197 | $78,719 |
| 2021 | $8,438 | $96,183 | $22,614 | $73,569 |
| 2020 | $7,848 | $89,058 | $20,939 | $68,119 |
| 2019 | $7,378 | $82,866 | $20,939 | $61,927 |
| 2018 | $7,234 | $78,995 | $19,961 | $59,034 |
| 2017 | $7,172 | $75,956 | $19,193 | $56,763 |
| 2016 | $7,046 | $73,744 | $18,634 | $55,110 |
| 2015 | $7,232 | $72,298 | $18,269 | $54,029 |
| 2014 | -- | $69,517 | $17,566 | $51,951 |
| 2013 | -- | $70,219 | $17,743 | $52,476 |
Source: Public Records
Map
Nearby Homes
- 3 Orchard Rd
- 123 Orchard Rd
- 2 Orchard Rd
- 22 Sherwick Rd
- 420 Chesterfield Ct Unit 420
- 10 Crofton Rd
- 4 Circle Ct
- 38 Ashlawn Ave
- 9 Cebold Dr
- 47 Old Post Rd
- 156 River Mist Dr
- 621 Mansfield Way
- 40 Codorus Rd
- 141 River Mist Dr
- 170 Chicago Rd
- 735 Alberta Ave
- 737 Alberta Ave
- 2110 State Route 31
- 739 Alberta Ave
- 633 Mansfield Way
- 309 Lombardy Ln
- 313 Lombardy Ln
- 127 Nottingham Ct
- 315 Lombardy Ln
- 307 Lombardy Ln
- 129 Nottingham Ct
- 125 Nottingham Ct
- 305 Lombardy Ln
- 449 Boulder Hill Pass Unit 3
- 317 Lombardy Ln
- 306 Lombardy Ln
- 447 Boulder Hill Pass
- 133 Nottingham Dr
- 131 Nottingham Dr
- 123 Nottingham Ct
- 304 Lombardy Ln
- 445 Boulder Hill Pass Unit 3
- 303 Lombardy Ln
- 135 Nottingham Dr
- 121 Nottingham Ct