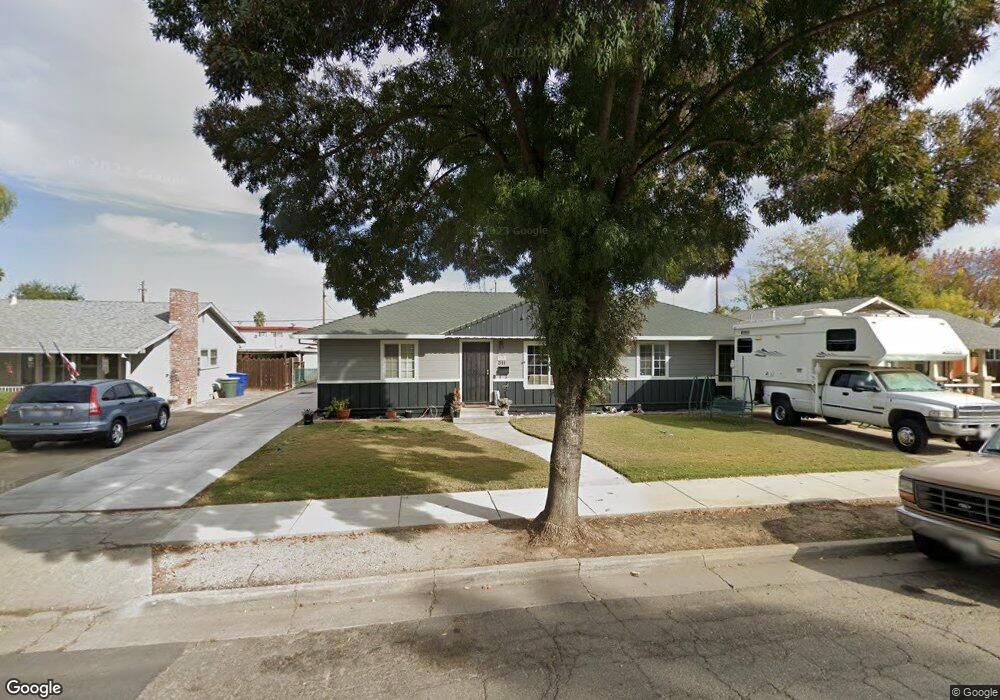
311 N 3rd St Patterson, CA 95363
Estimated Value: $279,000 - $494,000
3
Beds
2
Baths
2,106
Sq Ft
$206/Sq Ft
Est. Value
About This Home
This home is located at 311 N 3rd St, Patterson, CA 95363 and is currently estimated at $433,815, approximately $205 per square foot. 311 N 3rd St is a home located in Stanislaus County with nearby schools including Northmead Elementary School, Creekside Middle School, and Patterson High School.
Ownership History
Date
Name
Owned For
Owner Type
Purchase Details
Closed on
Feb 27, 2023
Sold by
Huse Donald L and Huse Theresa Marie
Bought by
Huse Family Trust
Current Estimated Value
Purchase Details
Closed on
Jan 11, 2017
Sold by
Huse Donald L
Bought by
Huse Donald L and Huse Theresa Marie
Purchase Details
Closed on
Jun 6, 2008
Sold by
Gama Gloria
Bought by
Gama Peter G
Home Financials for this Owner
Home Financials are based on the most recent Mortgage that was taken out on this home.
Original Mortgage
$134,995
Interest Rate
6.04%
Mortgage Type
New Conventional
Purchase Details
Closed on
Oct 5, 2006
Sold by
Huse Theresa Marie
Bought by
Huse Donald L
Home Financials for this Owner
Home Financials are based on the most recent Mortgage that was taken out on this home.
Original Mortgage
$215,000
Interest Rate
6.44%
Mortgage Type
New Conventional
Create a Home Valuation Report for This Property
The Home Valuation Report is an in-depth analysis detailing your home's value as well as a comparison with similar homes in the area
Home Values in the Area
Average Home Value in this Area
Purchase History
| Date | Buyer | Sale Price | Title Company |
|---|---|---|---|
| Huse Family Trust | -- | -- | |
| Huse Donald L | -- | None Available | |
| Gama Peter G | -- | Fidelity National Title Co | |
| Huse Donald L | -- | Alliance Title Company |
Source: Public Records
Mortgage History
| Date | Status | Borrower | Loan Amount |
|---|---|---|---|
| Previous Owner | Gama Peter G | $134,995 | |
| Previous Owner | Huse Donald L | $215,000 |
Source: Public Records
Tax History
| Year | Tax Paid | Tax Assessment Tax Assessment Total Assessment is a certain percentage of the fair market value that is determined by local assessors to be the total taxable value of land and additions on the property. | Land | Improvement |
|---|---|---|---|---|
| 2025 | $2,512 | $222,950 | $44,888 | $178,062 |
| 2024 | $2,503 | $218,579 | $44,008 | $174,571 |
| 2023 | $2,445 | $214,295 | $43,146 | $171,149 |
| 2022 | $2,304 | $210,094 | $42,300 | $167,794 |
| 2021 | $2,283 | $205,975 | $41,471 | $164,504 |
| 2020 | $2,270 | $203,864 | $41,046 | $162,818 |
| 2019 | $2,233 | $199,868 | $40,242 | $159,626 |
| 2018 | $2,123 | $195,950 | $39,453 | $156,497 |
| 2017 | $2,077 | $192,109 | $38,680 | $153,429 |
| 2016 | $2,019 | $188,343 | $37,922 | $150,421 |
| 2015 | $1,989 | $185,515 | $37,353 | $148,162 |
| 2014 | $1,942 | $181,882 | $36,622 | $145,260 |
Source: Public Records
Map
Nearby Homes
- 445 M St
- 701 N 3rd St
- 312 Roxanne Dr
- 250 E Las Palmas Ave Unit 13
- 517 Nordell Place
- 140 Ivy Ave Unit A5
- 140 Ivy Ave Unit 39
- 1430 Walnut Ave
- 600 Sears Dr
- 855 Toyon Ln
- 216 Barros St
- 15707 S 9th St
- 538 Chesterfield Dr
- 408 Peregrine Dr
- 801 Chatham Ln
- 0 Orange Ave
- 813 Chatham Ln
- 800 Chatham Ln
- 817 Chatham Ln
- 804 Chatham Ln
Your Personal Tour Guide
Ask me questions while you tour the home.