3110 Buckingham Rd Glendale, CA 91206
Chevy Chase NeighborhoodEstimated Value: $2,567,000 - $3,411,000
6
Beds
5
Baths
5,541
Sq Ft
$532/Sq Ft
Est. Value
About This Home
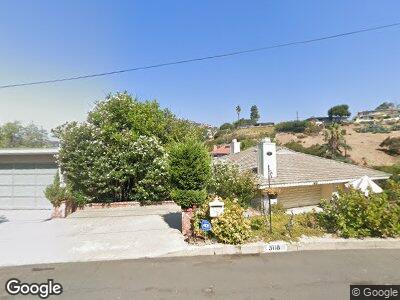
This home is located at 3110 Buckingham Rd, Glendale, CA 91206 and is currently estimated at $2,947,939, approximately $532 per square foot. 3110 Buckingham Rd is a home located in Los Angeles County with nearby schools including Glenoaks Elementary School, Woodrow Wilson Middle School, and Glendale High School.
Ownership History
Date
Name
Owned For
Owner Type
Purchase Details
Closed on
Nov 6, 2018
Sold by
Ranieri Joseph and Ranieri Maria Grazia
Bought by
Ranieri Joseph and Ranieri Maria Grazia
Current Estimated Value
Purchase Details
Closed on
Oct 31, 2011
Sold by
Ranieri Joseph P and Ranieri Family Trust
Bought by
Ranieri Joseph P
Purchase Details
Closed on
Apr 22, 2010
Sold by
Ranieri Family Trust
Bought by
Ranieri Joseph P
Purchase Details
Closed on
Dec 12, 2008
Sold by
Ranieri Joseph P
Bought by
Ranieri Joseph P and Ranieri Family Trust
Purchase Details
Closed on
May 30, 2003
Sold by
Ranieri Joseph P
Bought by
Ranieri Joseph P
Home Financials for this Owner
Home Financials are based on the most recent Mortgage that was taken out on this home.
Original Mortgage
$438,000
Interest Rate
5.71%
Mortgage Type
Purchase Money Mortgage
Purchase Details
Closed on
Jun 1, 1993
Sold by
Ranieri Joseph P and Ranieri Lena V
Bought by
Ranieri Joseph P and Ranieri Lena V
Create a Home Valuation Report for This Property
The Home Valuation Report is an in-depth analysis detailing your home's value as well as a comparison with similar homes in the area
Home Values in the Area
Average Home Value in this Area
Purchase History
| Date | Buyer | Sale Price | Title Company |
|---|---|---|---|
| Ranieri Joseph | -- | None Available | |
| Ranieri Joseph P | -- | None Available | |
| Ranieri Joseph P | -- | None Available | |
| Ranieri Joseph P | -- | Fidelity | |
| Ranieri Joseph P | -- | Old Republic Title |
Source: Public Records
Mortgage History
| Date | Status | Borrower | Loan Amount |
|---|---|---|---|
| Previous Owner | Ranieri Joseph P | $438,000 |
Source: Public Records
Tax History Compared to Growth
Tax History
| Year | Tax Paid | Tax Assessment Tax Assessment Total Assessment is a certain percentage of the fair market value that is determined by local assessors to be the total taxable value of land and additions on the property. | Land | Improvement |
|---|---|---|---|---|
| 2024 | $5,625 | $446,839 | $203,108 | $243,731 |
| 2023 | $5,512 | $438,078 | $199,126 | $238,952 |
| 2022 | $5,421 | $429,489 | $195,222 | $234,267 |
| 2021 | $5,303 | $421,069 | $191,395 | $229,674 |
| 2019 | $5,118 | $408,581 | $185,719 | $222,862 |
| 2018 | $4,800 | $400,571 | $182,078 | $218,493 |
| 2016 | $4,526 | $385,017 | $175,008 | $210,009 |
| 2015 | $4,439 | $379,235 | $172,380 | $206,855 |
| 2014 | $4,439 | $371,807 | $169,004 | $202,803 |
Source: Public Records
Map
Nearby Homes
- 3275 Buckingham Rd
- 3620 Saint Elizabeth Rd
- 3255 Buckingham Rd
- 3297 Dunsmere Rd
- 3476 Linda Vista Rd
- 3000 Cornwall Dr
- 1602 Golf Club Dr
- 3941 Karen Lynn Dr
- 3153 Dragonfly St
- 1985 Erin Way
- 3195 Chadney Dr
- 2911 E Chevy Chase Dr
- 0 Greenwich Unit PF25073022
- 0 Greenwich Unit PF25072811
- 1425 Belleau Rd
- 1650 Knollwood Dr
- 0 Whitehall Ct Unit PF24165185
- 3845 Hampstead Rd
- 1555 Scenic Dr
- 3873 Hampstead Rd
- 3110 Buckingham Rd
- 3106 Buckingham Rd
- 3104 Buckingham Rd
- 1917 Sussex Ct
- 3124 Buckingham Rd
- 3118 Buckingham Rd
- 3130 Buckingham Rd
- 3096 Buckingham Rd
- 3316 E Chevy Chase Dr
- 1912 Sussex Ct
- 1909 Sussex Ct
- 3380 E Chevy Chase Dr
- 3140 Buckingham Rd
- 3310 E Chevy Chase Dr
- 3129 Buckingham Rd
- 3094 Buckingham Rd
- 3310 Buckingham Rd
- 3100 Buckingham Rd
- 1907 Sussex Ct
- 1908 Sussex Ct