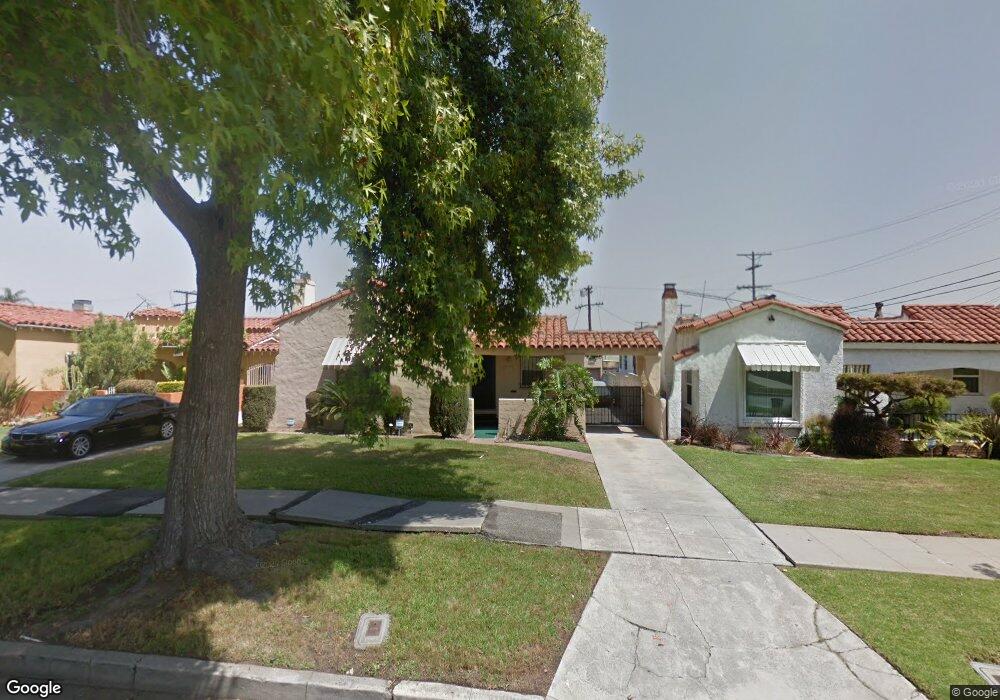
3119 W 77th St Los Angeles, CA 90043
Hyde Park NeighborhoodEstimated Value: $712,000 - $836,000
3
Beds
2
Baths
1,422
Sq Ft
$563/Sq Ft
Est. Value
About This Home
This home is located at 3119 W 77th St, Los Angeles, CA 90043 and is currently estimated at $800,032, approximately $562 per square foot. 3119 W 77th St is a home located in Los Angeles County with nearby schools including Seventy-Fourth Street Elementary School, Horace Mann Ucla Community, and Crenshaw Science, Technology, Engineering, Math And Medicine Magnet.
Ownership History
Date
Name
Owned For
Owner Type
Purchase Details
Closed on
Mar 19, 2025
Sold by
Kyle Arcola
Bought by
Arcola Kyle Living Trust and Kyle
Current Estimated Value
Purchase Details
Closed on
Aug 21, 1995
Sold by
Federal National Mortgage Association
Bought by
Kyle Arcola
Home Financials for this Owner
Home Financials are based on the most recent Mortgage that was taken out on this home.
Original Mortgage
$144,500
Interest Rate
7.88%
Purchase Details
Closed on
Nov 15, 1994
Sold by
Coast Federal Bank Fsb
Bought by
Federal National Mortgage Association
Purchase Details
Closed on
Nov 2, 1994
Sold by
Marshall Dana and Wheeler Aaron
Bought by
Coast Federal Bank Fsb
Purchase Details
Closed on
Aug 23, 1994
Sold by
Marshall Dana and Wheeler Aaron
Bought by
Boston Harbor Corp
Create a Home Valuation Report for This Property
The Home Valuation Report is an in-depth analysis detailing your home's value as well as a comparison with similar homes in the area
Home Values in the Area
Average Home Value in this Area
Purchase History
| Date | Buyer | Sale Price | Title Company |
|---|---|---|---|
| Arcola Kyle Living Trust | -- | None Listed On Document | |
| Kyle Arcola | $149,000 | Investors Title Company | |
| Federal National Mortgage Association | -- | -- | |
| Coast Federal Bank Fsb | $165,000 | Stewart Title | |
| Boston Harbor Corp | -- | -- |
Source: Public Records
Mortgage History
| Date | Status | Borrower | Loan Amount |
|---|---|---|---|
| Previous Owner | Kyle Arcola | $144,500 |
Source: Public Records
Tax History Compared to Growth
Tax History
| Year | Tax Paid | Tax Assessment Tax Assessment Total Assessment is a certain percentage of the fair market value that is determined by local assessors to be the total taxable value of land and additions on the property. | Land | Improvement |
|---|---|---|---|---|
| 2025 | $4,868 | $247,499 | $175,417 | $72,082 |
| 2024 | $4,868 | $242,647 | $171,978 | $70,669 |
| 2023 | $4,814 | $237,890 | $168,606 | $69,284 |
| 2022 | $4,681 | $233,226 | $165,300 | $67,926 |
| 2021 | $4,635 | $228,654 | $162,059 | $66,595 |
| 2019 | $4,552 | $221,874 | $157,253 | $64,621 |
| 2018 | $4,476 | $217,524 | $154,170 | $63,354 |
| 2016 | $4,345 | $209,080 | $148,185 | $60,895 |
| 2015 | $2,569 | $205,941 | $145,960 | $59,981 |
| 2014 | $2,587 | $201,908 | $143,101 | $58,807 |
Source: Public Records
Map
Nearby Homes
- 4719 4719 S 8th Ave
- 3155 W 76th St
- 2923 W 76th St
- 7716 1/2 Crenshaw Blvd
- 7806 Crenshaw Blvd
- 7810 Crenshaw Blvd
- 3012 W 73rd St
- 3311 W 79th St
- 7220 10th Ave
- 7323 Crenshaw Blvd
- 2603 W 75th St
- 3201 W Florence Ave
- 7830 S Victoria Ave
- 3120 W 71st St
- 3500 W 78th St
- 3436 W 79th St
- 7036 6th Ave
- 2400 W 74th St
- 2407 W 74th St
- 6812 11th Ave