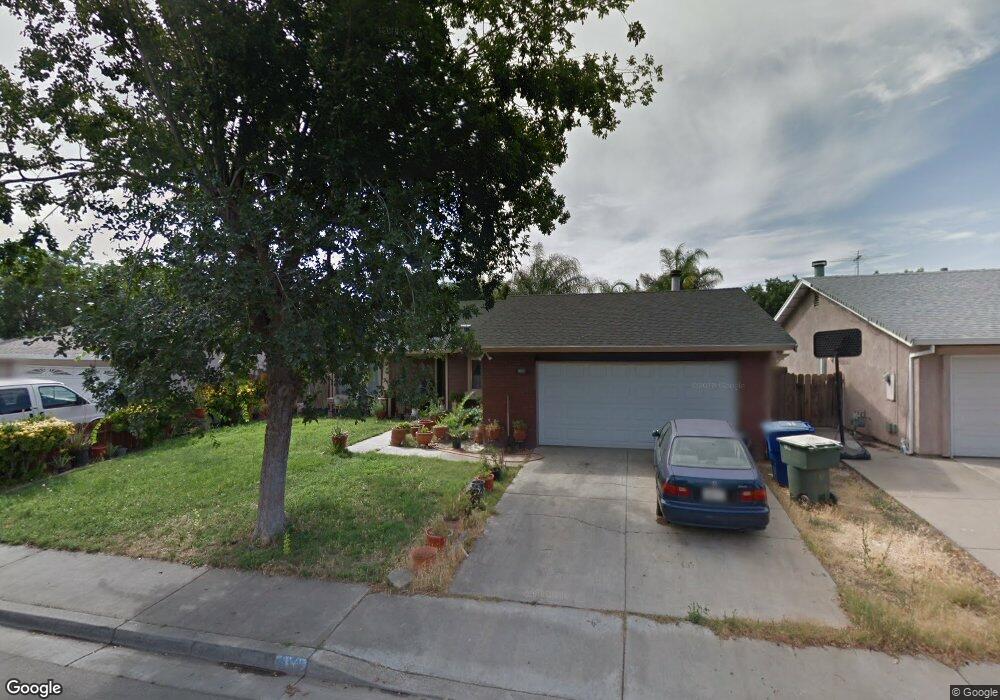
312 Berlin Way Patterson, CA 95363
Estimated Value: $264,000 - $430,000
3
Beds
2
Baths
1,288
Sq Ft
$295/Sq Ft
Est. Value
About This Home
This home is located at 312 Berlin Way, Patterson, CA 95363 and is currently estimated at $380,242, approximately $295 per square foot. 312 Berlin Way is a home located in Stanislaus County with nearby schools including Walnut Grove Elementary School, Creekside Middle School, and Patterson High School.
Ownership History
Date
Name
Owned For
Owner Type
Purchase Details
Closed on
Jun 11, 2002
Sold by
Sandoval Juan F
Bought by
Sandoval Barbara
Current Estimated Value
Purchase Details
Closed on
Sep 20, 1999
Sold by
Lothrop John
Bought by
Sandoval Juan F
Home Financials for this Owner
Home Financials are based on the most recent Mortgage that was taken out on this home.
Original Mortgage
$111,328
Outstanding Balance
$32,853
Interest Rate
7.76%
Mortgage Type
FHA
Estimated Equity
$347,389
Purchase Details
Closed on
Sep 2, 1999
Sold by
Lothrop Gail
Bought by
Sandoval Juan F
Home Financials for this Owner
Home Financials are based on the most recent Mortgage that was taken out on this home.
Original Mortgage
$111,328
Outstanding Balance
$32,853
Interest Rate
7.76%
Mortgage Type
FHA
Estimated Equity
$347,389
Create a Home Valuation Report for This Property
The Home Valuation Report is an in-depth analysis detailing your home's value as well as a comparison with similar homes in the area
Home Values in the Area
Average Home Value in this Area
Purchase History
| Date | Buyer | Sale Price | Title Company |
|---|---|---|---|
| Sandoval Barbara | -- | -- | |
| Sandoval Juan F | $105,000 | Fidelity National Title Co | |
| Sandoval Juan F | $105,000 | Fidelity National Title Co |
Source: Public Records
Mortgage History
| Date | Status | Borrower | Loan Amount |
|---|---|---|---|
| Open | Sandoval Juan F | $111,328 | |
| Closed | Sandoval Juan F | $111,328 |
Source: Public Records
Tax History
| Year | Tax Paid | Tax Assessment Tax Assessment Total Assessment is a certain percentage of the fair market value that is determined by local assessors to be the total taxable value of land and additions on the property. | Land | Improvement |
|---|---|---|---|---|
| 2025 | $3,001 | $258,507 | $86,890 | $171,617 |
| 2024 | $2,992 | $253,439 | $85,187 | $168,252 |
| 2023 | $2,924 | $248,470 | $83,517 | $164,953 |
| 2022 | $2,757 | $243,599 | $81,880 | $161,719 |
| 2021 | $2,734 | $238,824 | $80,275 | $158,549 |
| 2020 | $2,719 | $236,376 | $79,452 | $156,924 |
| 2019 | $2,677 | $231,743 | $77,895 | $153,848 |
| 2018 | $2,547 | $227,200 | $76,368 | $150,832 |
| 2017 | $2,493 | $222,746 | $74,871 | $147,875 |
| 2016 | $2,425 | $218,379 | $73,403 | $144,976 |
| 2015 | $2,099 | $188,500 | $33,500 | $155,000 |
| 2014 | $1,566 | $140,500 | $25,000 | $115,500 |
Source: Public Records
Map
Nearby Homes
- 517 Nordell Place
- 250 E Las Palmas Ave Unit 13
- 600 Sears Dr
- 1430 Walnut Ave
- 538 Chesterfield Dr
- 814 Bogdanich Pkwy
- 564 Millwood Dr
- 518 Bedfordshire Dr
- 701 N 3rd St
- 801 Chatham Ln
- 800 Chatham Ln
- 445 M St
- 804 Chatham Ln
- 813 Chatham Ln
- 108 N 6th St
- 817 Chatham Ln
- 812 Chatham Ln
- 737 Featherstone Dr
- 821 Chatham Ln
- 816 Chatham Ln
Your Personal Tour Guide
Ask me questions while you tour the home.