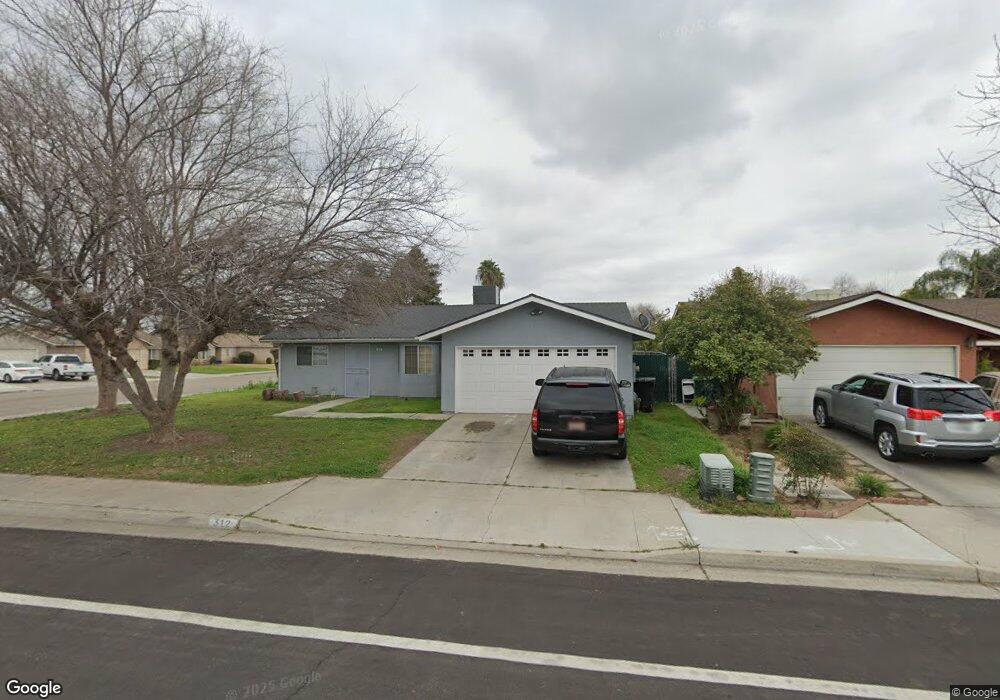
312 Faller Ave Sanger, CA 93657
Estimated Value: $335,000 - $367,000
3
Beds
2
Baths
1,531
Sq Ft
$226/Sq Ft
Est. Value
About This Home
This home is located at 312 Faller Ave, Sanger, CA 93657 and is currently estimated at $345,722, approximately $225 per square foot. 312 Faller Ave is a home located in Fresno County with nearby schools including Wilson Elementary School, Washington Academic Middle School, and Sanger High School.
Ownership History
Date
Name
Owned For
Owner Type
Purchase Details
Closed on
Aug 26, 1997
Sold by
Rachel Gutierrez and Vicente Garcia
Bought by
Gutierrez Rachel
Current Estimated Value
Purchase Details
Closed on
Oct 27, 1995
Sold by
Gutierrez Rachel
Bought by
Gutierrez Rachel and Garcia Vicente
Home Financials for this Owner
Home Financials are based on the most recent Mortgage that was taken out on this home.
Original Mortgage
$79,814
Outstanding Balance
$1,114
Interest Rate
7.58%
Mortgage Type
FHA
Estimated Equity
$344,608
Purchase Details
Closed on
May 22, 1995
Sold by
Medelez Lorenzo
Bought by
Gutierrez Rachel
Create a Home Valuation Report for This Property
The Home Valuation Report is an in-depth analysis detailing your home's value as well as a comparison with similar homes in the area
Home Values in the Area
Average Home Value in this Area
Purchase History
| Date | Buyer | Sale Price | Title Company |
|---|---|---|---|
| Gutierrez Rachel | -- | -- | |
| Gutierrez Rachel | -- | Chicago Title Co | |
| Gutierrez Rachel | -- | -- |
Source: Public Records
Mortgage History
| Date | Status | Borrower | Loan Amount |
|---|---|---|---|
| Open | Gutierrez Rachel | $79,814 |
Source: Public Records
Tax History
| Year | Tax Paid | Tax Assessment Tax Assessment Total Assessment is a certain percentage of the fair market value that is determined by local assessors to be the total taxable value of land and additions on the property. | Land | Improvement |
|---|---|---|---|---|
| 2025 | $1,657 | $129,421 | $39,253 | $90,168 |
| 2023 | $1,552 | $124,397 | $37,730 | $86,667 |
| 2022 | $1,529 | $121,959 | $36,991 | $84,968 |
| 2021 | $1,517 | $119,568 | $36,266 | $83,302 |
| 2020 | $1,473 | $118,343 | $35,895 | $82,448 |
| 2019 | $1,444 | $116,024 | $35,192 | $80,832 |
| 2018 | $1,384 | $113,750 | $34,502 | $79,248 |
| 2017 | $1,361 | $111,521 | $33,826 | $77,695 |
| 2016 | $1,280 | $109,335 | $33,163 | $76,172 |
| 2015 | $1,290 | $107,693 | $32,665 | $75,028 |
| 2014 | $1,273 | $105,585 | $32,026 | $73,559 |
Source: Public Records
Map
Nearby Homes
Your Personal Tour Guide
Ask me questions while you tour the home.