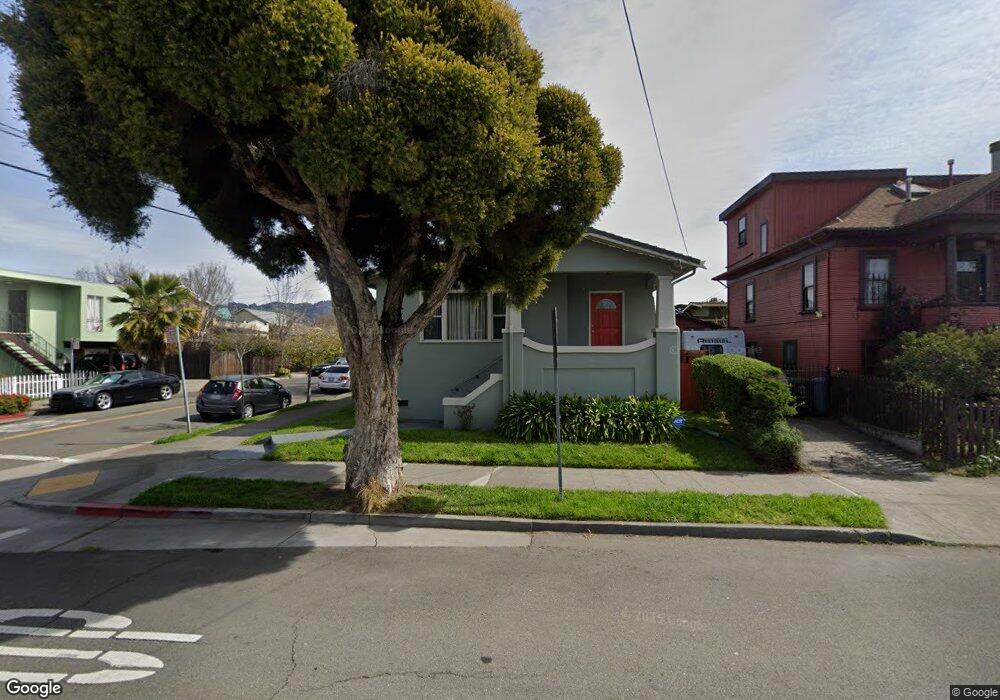
3121 Mabel St Berkeley, CA 94702
West Berkeley NeighborhoodEstimated Value: $857,000 - $1,196,000
2
Beds
1
Bath
1,226
Sq Ft
$824/Sq Ft
Est. Value
About This Home
This home is located at 3121 Mabel St, Berkeley, CA 94702 and is currently estimated at $1,010,081, approximately $823 per square foot. 3121 Mabel St is a home located in Alameda County with nearby schools including Malcolm X Elementary School, Washington Elementary School, and Oxford Elementary School.
Ownership History
Date
Name
Owned For
Owner Type
Purchase Details
Closed on
May 17, 2023
Sold by
Won Yuri
Bought by
Yuri Won Trust
Current Estimated Value
Purchase Details
Closed on
Aug 21, 2001
Sold by
R P Real Estate Llc
Bought by
Won Yuri
Home Financials for this Owner
Home Financials are based on the most recent Mortgage that was taken out on this home.
Original Mortgage
$251,200
Interest Rate
7.21%
Purchase Details
Closed on
Jan 17, 2001
Sold by
Monopoly Game Llc
Bought by
R P Real Estate Llc
Home Financials for this Owner
Home Financials are based on the most recent Mortgage that was taken out on this home.
Original Mortgage
$155,150
Interest Rate
7.54%
Purchase Details
Closed on
Nov 15, 2000
Sold by
Dream Ventures Llc
Bought by
Reese Vurma
Purchase Details
Closed on
Nov 7, 2000
Sold by
Reese Vurma J
Bought by
Monopoly Game Llc
Purchase Details
Closed on
Nov 1, 2000
Sold by
Reese Vurma J
Bought by
Dream Ventures Llc
Create a Home Valuation Report for This Property
The Home Valuation Report is an in-depth analysis detailing your home's value as well as a comparison with similar homes in the area
Home Values in the Area
Average Home Value in this Area
Purchase History
| Date | Buyer | Sale Price | Title Company |
|---|---|---|---|
| Yuri Won Trust | -- | None Listed On Document | |
| Won Yuri | $314,000 | Placer Title Company | |
| R P Real Estate Llc | $191,500 | Chicago Title Co | |
| Reese Vurma | $39,500 | Chicago Title | |
| Monopoly Game Llc | $57,000 | Chicago Title | |
| Dream Ventures Llc | $39,500 | -- |
Source: Public Records
Mortgage History
| Date | Status | Borrower | Loan Amount |
|---|---|---|---|
| Previous Owner | Won Yuri | $251,200 | |
| Previous Owner | R P Real Estate Llc | $155,150 | |
| Closed | Won Yuri | $22,800 |
Source: Public Records
Tax History
| Year | Tax Paid | Tax Assessment Tax Assessment Total Assessment is a certain percentage of the fair market value that is determined by local assessors to be the total taxable value of land and additions on the property. | Land | Improvement |
|---|---|---|---|---|
| 2025 | $7,982 | $456,840 | $139,152 | $324,688 |
| 2024 | $7,982 | $447,747 | $136,424 | $318,323 |
| 2023 | $7,805 | $445,832 | $133,749 | $312,083 |
| 2022 | $7,641 | $430,090 | $131,127 | $305,963 |
| 2021 | $7,642 | $421,521 | $128,556 | $299,965 |
| 2020 | $7,181 | $424,128 | $127,238 | $296,890 |
| 2019 | $6,841 | $415,814 | $124,744 | $291,070 |
| 2018 | $6,712 | $407,662 | $122,298 | $285,364 |
| 2017 | $6,465 | $399,671 | $119,901 | $279,770 |
| 2016 | $6,216 | $391,837 | $117,551 | $274,286 |
| 2015 | $6,126 | $385,952 | $115,785 | $270,167 |
| 2014 | $6,068 | $378,394 | $113,518 | $264,876 |
Source: Public Records
Map
Nearby Homes
- 1080 67th St
- 3032 Mabel St
- 1314 Ashby Ave
- 6500 San Pablo Ave
- 1237 Ashby Ave
- 6501 San Pablo Ave Unit 410
- 6465 San Pablo Ave Unit 306
- 6465 San Pablo Ave Unit 203
- 1126 Ocean Ave
- 3101 Sacramento St
- 1507 Prince St
- 2922 Stanton St
- 1164 Ocean Ave
- 3224 Sacramento St
- 1124 63rd St
- 1161 64th St
- 1200 65th St Unit 224
- 3110 California St
- 3114 California St
- 3138 California St
Your Personal Tour Guide
Ask me questions while you tour the home.