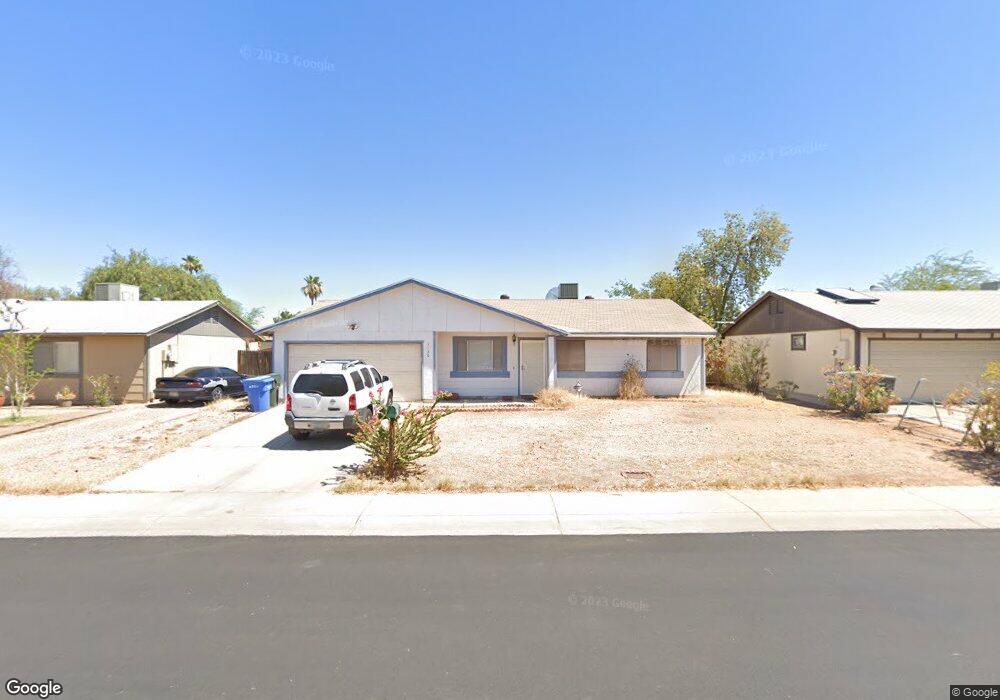
3130 W Libby St Phoenix, AZ 85053
Deer Valley NeighborhoodEstimated Value: $277,104 - $349,000
Studio
2
Baths
1,218
Sq Ft
$262/Sq Ft
Est. Value
About This Home
This home is located at 3130 W Libby St, Phoenix, AZ 85053 and is currently estimated at $318,776, approximately $261 per square foot. 3130 W Libby St is a home located in Maricopa County with nearby schools including Sunrise Elementary School, Desert Sky Middle School, and Deer Valley High School.
Ownership History
Date
Name
Owned For
Owner Type
Purchase Details
Closed on
Jan 13, 1998
Sold by
Coates Charles E
Bought by
Dean Robin M
Current Estimated Value
Home Financials for this Owner
Home Financials are based on the most recent Mortgage that was taken out on this home.
Original Mortgage
$73,097
Outstanding Balance
$12,473
Interest Rate
6.95%
Mortgage Type
FHA
Estimated Equity
$306,303
Purchase Details
Closed on
Sep 27, 1994
Sold by
Coates Tammy M
Bought by
Coates Charles E
Home Financials for this Owner
Home Financials are based on the most recent Mortgage that was taken out on this home.
Original Mortgage
$61,750
Interest Rate
8.58%
Mortgage Type
FHA
Purchase Details
Closed on
Aug 31, 1994
Sold by
Knadler Fred
Bought by
Coates Charles E
Home Financials for this Owner
Home Financials are based on the most recent Mortgage that was taken out on this home.
Original Mortgage
$61,750
Interest Rate
8.58%
Mortgage Type
FHA
Purchase Details
Closed on
Apr 7, 1994
Sold by
Hubert Kent L and Hubert Darlynn R
Bought by
Knadler Fred
Create a Home Valuation Report for This Property
The Home Valuation Report is an in-depth analysis detailing your home's value as well as a comparison with similar homes in the area
Home Values in the Area
Average Home Value in this Area
Purchase History
| Date | Buyer | Sale Price | Title Company |
|---|---|---|---|
| Dean Robin M | $73,500 | Stewart Title & Trust | |
| Coates Charles E | -- | -- | |
| Coates Charles E | $65,000 | United Title Agency | |
| Knadler Fred | $39,900 | Old Republic Title Agency |
Source: Public Records
Mortgage History
| Date | Status | Borrower | Loan Amount |
|---|---|---|---|
| Open | Dean Robin M | $73,097 | |
| Previous Owner | Coates Charles E | $61,750 |
Source: Public Records
Tax History
| Year | Tax Paid | Tax Assessment Tax Assessment Total Assessment is a certain percentage of the fair market value that is determined by local assessors to be the total taxable value of land and additions on the property. | Land | Improvement |
|---|---|---|---|---|
| 2025 | $774 | $8,899 | -- | -- |
| 2024 | $753 | $8,475 | -- | -- |
| 2023 | $753 | $24,520 | $4,900 | $19,620 |
| 2022 | $725 | $18,760 | $3,750 | $15,010 |
| 2021 | $757 | $17,020 | $3,400 | $13,620 |
| 2020 | $743 | $15,930 | $3,180 | $12,750 |
| 2019 | $721 | $14,300 | $2,860 | $11,440 |
| 2018 | $696 | $12,900 | $2,580 | $10,320 |
| 2017 | $672 | $10,900 | $2,180 | $8,720 |
| 2016 | $634 | $10,410 | $2,080 | $8,330 |
| 2015 | $566 | $9,620 | $1,920 | $7,700 |
Source: Public Records
Map
Nearby Homes
- 3020 W Muriel Dr
- 3008 W Angela Dr
- 18026 N 34th Ave
- 18415 N 33rd Ave
- 17848 N 34th Ln
- 3024 W Wagoner Rd
- 17641 N 34th Ln
- 17853 N 35th Ave
- 18209 N 34th Ln
- 17226 N 31st Ave
- 3434 W Danbury Dr Unit 103
- 18803 N 33rd Dr
- 17428 N 36th Dr
- 3401 W Morrow Dr Unit 5
- 3426 W Juniper Ave
- 18426 N 36th Dr
- 3660 W Bluefield Ave
- 3422 W Kimberly Way
- 17239 N 37th Ave
- 16646 N 29th Dr
- 3134 W Libby St
- 3124 W Libby St
- 3131 W Charleston Ave
- 3135 W Charleston Ave
- 3135 W Charleston Ave Unit 1
- 3125 W Charleston Ave
- 3140 W Libby St
- 3133 W Libby St
- 3127 W Libby St
- 3141 W Charleston Ave
- 3121 W Libby St
- 3144 W Libby St
- 17831 N 31st Dr
- 3139 W Libby St
- 17825 N 31st Dr
- 17837 N 31st Dr
- 3145 W Charleston Ave
- 3130 W Charleston Ave
- 17819 N 31st Dr
- 3134 W Charleston Ave
Your Personal Tour Guide
Ask me questions while you tour the home.