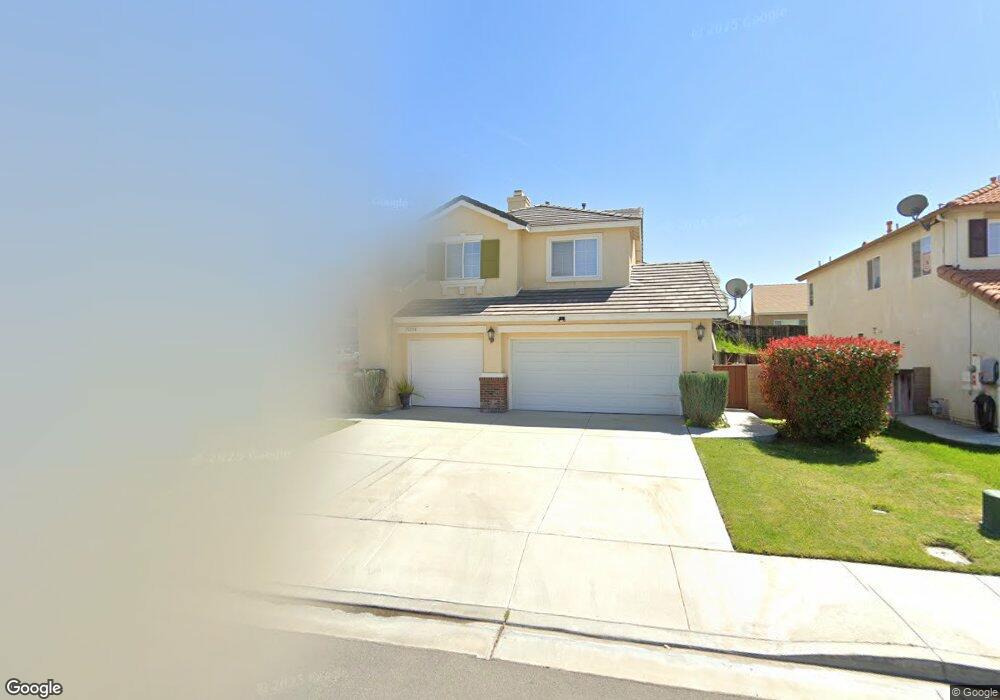
31306 Euclid Loop Winchester, CA 92596
Estimated Value: $674,005 - $716,000
5
Beds
3
Baths
2,671
Sq Ft
$261/Sq Ft
Est. Value
About This Home
This home is located at 31306 Euclid Loop, Winchester, CA 92596 and is currently estimated at $696,251, approximately $260 per square foot. 31306 Euclid Loop is a home located in Riverside County with nearby schools including Lisa J. Mails Elementary School, Dorothy McElhinney Middle School, and Vista Murrieta High School.
Ownership History
Date
Name
Owned For
Owner Type
Purchase Details
Closed on
Jan 10, 2009
Sold by
Cruz Joanna
Bought by
Torres Antonia
Current Estimated Value
Purchase Details
Closed on
Oct 20, 2008
Sold by
Torres Antonia
Bought by
Cruz Joanna
Purchase Details
Closed on
Nov 17, 2004
Sold by
Cruz Joanna
Bought by
Torres Antonia
Home Financials for this Owner
Home Financials are based on the most recent Mortgage that was taken out on this home.
Original Mortgage
$370,560
Interest Rate
6.62%
Mortgage Type
Purchase Money Mortgage
Purchase Details
Closed on
Dec 30, 2003
Sold by
Richmond American Homes Of Ca Inc
Bought by
Torres Antonia and Cruz Joanna
Home Financials for this Owner
Home Financials are based on the most recent Mortgage that was taken out on this home.
Original Mortgage
$263,593
Interest Rate
5.1%
Mortgage Type
Purchase Money Mortgage
Create a Home Valuation Report for This Property
The Home Valuation Report is an in-depth analysis detailing your home's value as well as a comparison with similar homes in the area
Home Values in the Area
Average Home Value in this Area
Purchase History
| Date | Buyer | Sale Price | Title Company |
|---|---|---|---|
| Torres Antonia | -- | None Available | |
| Cruz Joanna | -- | None Available | |
| Torres Antonia | -- | Lawyers Title Company | |
| Torres Antonia | $329,500 | First American Title Co |
Source: Public Records
Mortgage History
| Date | Status | Borrower | Loan Amount |
|---|---|---|---|
| Previous Owner | Torres Antonia | $370,560 | |
| Previous Owner | Torres Antonia | $263,593 | |
| Closed | Torres Antonia | $65,898 | |
| Closed | Torres Antonia | $92,640 |
Source: Public Records
Tax History Compared to Growth
Tax History
| Year | Tax Paid | Tax Assessment Tax Assessment Total Assessment is a certain percentage of the fair market value that is determined by local assessors to be the total taxable value of land and additions on the property. | Land | Improvement |
|---|---|---|---|---|
| 2025 | $5,644 | $282,000 | $103,010 | $178,990 |
| 2023 | $5,644 | $271,052 | $99,011 | $172,041 |
| 2022 | $5,536 | $265,738 | $97,070 | $168,668 |
| 2021 | $5,370 | $260,528 | $95,167 | $165,361 |
| 2020 | $5,308 | $257,858 | $94,192 | $163,666 |
| 2019 | $5,214 | $252,803 | $92,346 | $160,457 |
| 2018 | $5,037 | $247,847 | $90,536 | $157,311 |
| 2017 | $4,996 | $242,988 | $88,761 | $154,227 |
| 2016 | $4,958 | $238,224 | $87,021 | $151,203 |
| 2015 | $4,927 | $234,648 | $85,715 | $148,933 |
| 2014 | $4,795 | $230,053 | $84,037 | $146,016 |
Source: Public Records
Map
Nearby Homes
- 31343 Kailua Dr
- 35430 Azalea Cir
- 31138 Euclid Loop
- 35442 Marabella Ct
- 31022 Janelle Ln
- 31550 Alicante Loop
- 35591 Denver Cir
- 35087 Nightingale St
- 31397 Lolite Dr
- 31530 Dylan Rd
- 31391 Lolite Dr
- 31545 Angel Aura Dr
- 31664 Cobalite Dr
- 31379 Lolite Dr
- 31415 Lolite Dr
- 31409 Lolite Dr
- 31403 Lolite Dr
- 31416 Lolite Dr
- 31669 Viviante Dr
- 31422 Lolite Dr
- 31318 Euclid Loop
- 31294 Euclid Loop
- 31430 Janelle Ln
- 31442 Janelle Ln
- 31418 Janelle Ln
- 31330 Euclid Loop
- 31282 Euclid Loop
- 31313 Euclid Loop
- 31394 Janelle Ln
- 31289 Euclid Loop
- 31325 Euclid Loop
- 31454 Janelle Ln
- 31342 Euclid Loop
- 31382 Janelle Ln
- 31265 Euclid Loop
- 31270 Euclid Loop
- 31307 Bermuda St
- 31349 Euclid Loop
- 31219 Dogwood Cir
- 31207 Dogwood Cir