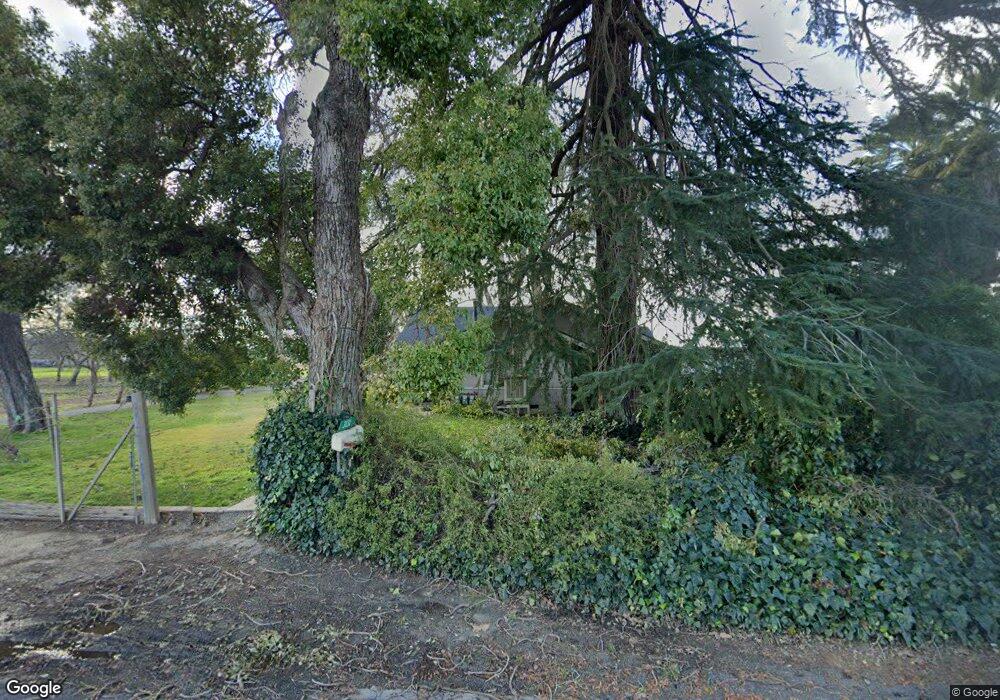
3131 Mountain View Rd Hughson, CA 95326
Estimated Value: $616,000 - $941,000
3
Beds
3
Baths
1,686
Sq Ft
$421/Sq Ft
Est. Value
About This Home
This home is located at 3131 Mountain View Rd, Hughson, CA 95326 and is currently estimated at $710,168, approximately $421 per square foot. 3131 Mountain View Rd is a home located in Stanislaus County with nearby schools including Hughson Elementary School, Fox Road Elementary School, and Emilie J. Ross Middle School.
Ownership History
Date
Name
Owned For
Owner Type
Purchase Details
Closed on
Dec 21, 2018
Sold by
Starn Paul Howard
Bought by
Starn Paul
Current Estimated Value
Purchase Details
Closed on
May 10, 2017
Sold by
Starn John R
Bought by
Starn John R and Starn Donna J
Purchase Details
Closed on
Sep 26, 2014
Sold by
Starn Clifford M
Bought by
Starn Clifford M and Starn Sandra L
Purchase Details
Closed on
Jul 10, 2009
Sold by
Starn John R
Bought by
Starn John R and Starn Donna J
Purchase Details
Closed on
May 4, 2009
Sold by
Starn Charles C
Bought by
Starn Charles C and Starn Joan P
Purchase Details
Closed on
Dec 19, 2008
Sold by
Starn Clifford Moore
Bought by
Starn Paul Howard
Purchase Details
Closed on
May 13, 1994
Sold by
Herrera Jose and Herrera Guadalupe
Bought by
Starn Rolland C and Starn Patricia M
Create a Home Valuation Report for This Property
The Home Valuation Report is an in-depth analysis detailing your home's value as well as a comparison with similar homes in the area
Home Values in the Area
Average Home Value in this Area
Purchase History
| Date | Buyer | Sale Price | Title Company |
|---|---|---|---|
| Starn Paul | -- | None Available | |
| Starn John R | -- | None Available | |
| Starn John R | -- | None Available | |
| Starn John R | -- | None Available | |
| Starn Clifford M | -- | None Available | |
| Starn John R | -- | None Available | |
| Starn Charles C | -- | None Available | |
| Starn Paul Howard | -- | None Available | |
| Starn John Rolland | -- | None Available | |
| Starn Charles Clark | -- | None Available | |
| Starn Clifford Moore | -- | None Available | |
| Starn Paul Howard | -- | None Available | |
| Starn Charles Clark | -- | None Available | |
| Starn John Rolland | -- | None Available | |
| Starn Clifford Moore | -- | None Available | |
| Starn Rolland C | $120,000 | Fidelity National Title |
Source: Public Records
Tax History Compared to Growth
Tax History
| Year | Tax Paid | Tax Assessment Tax Assessment Total Assessment is a certain percentage of the fair market value that is determined by local assessors to be the total taxable value of land and additions on the property. | Land | Improvement |
|---|---|---|---|---|
| 2025 | $5,262 | $457,090 | $305,384 | $151,706 |
| 2024 | $4,938 | $448,129 | $299,397 | $148,732 |
| 2023 | $4,825 | $439,343 | $293,527 | $145,816 |
| 2022 | $4,751 | $430,729 | $287,772 | $142,957 |
| 2021 | $4,420 | $400,000 | $289,500 | $110,500 |
| 2020 | $4,058 | $374,000 | $265,500 | $108,500 |
| 2019 | $4,158 | $374,000 | $265,500 | $108,500 |
| 2018 | $3,671 | $333,000 | $232,500 | $100,500 |
| 2017 | $3,362 | $296,000 | $206,500 | $89,500 |
| 2016 | $3,770 | $346,000 | $223,000 | $123,000 |
| 2015 | $2,793 | $255,500 | $144,500 | $111,000 |
| 2014 | $2,319 | $210,000 | $109,000 | $101,000 |
Source: Public Records
Map
Nearby Homes
- 2100 3rd St
- 2301 5th St
- 7306 Elm St
- 4460 Mountain View Rd
- 2136 4th St
- 1704 San Gabriel Dr
- Plan 1985 at Parkwood - Heritage at Parkwood
- Plan 1398 at Parkwood - Orchards at Parkwood
- Plan 1705 at Parkwood - Orchards at Parkwood
- Plan 2161 Modeled at Parkwood - Orchards at Parkwood
- Plan 1950 Modeled at Parkwood - Orchards at Parkwood
- Plan 1600 Modeled at Parkwood - Orchards at Parkwood
- Plan 2202 at Parkwood - Heritage at Parkwood
- Plan 2150 Modeled at Parkwood - Heritage at Parkwood
- Plan 2775 at Parkwood - Heritage at Parkwood
- Plan 2541 Modeled at Parkwood - Heritage at Parkwood
- 2318 7th St
- 4999 Pioneer Rd
- 6304 Snow Beauty Way
- 6336 Snow Beauty Way
- 3107 Mountain View Rd
- 3219 Mountain View Rd
- 3019 Mountain View Rd
- 6154 Roeding Rd
- 6206 Roeding Rd
- 2825 Mountain View Rd
- 6400 Roeding Rd
- 5949 Roeding Rd
- 6449 Roeding Rd
- 6424 Roeding Rd
- 2619 Mountain View Rd
- 6106 E Whitmore Ave
- 2501 Mountain View Rd
- 6130 E Whitmore Ave
- 6030 E Whitmore Ave
- 6012 E Whitmore Ave
- 6542 Roeding Rd
- 5736 Roeding Rd
- 5936 E Whitmore Ave
- 6225 E Whitmore Ave