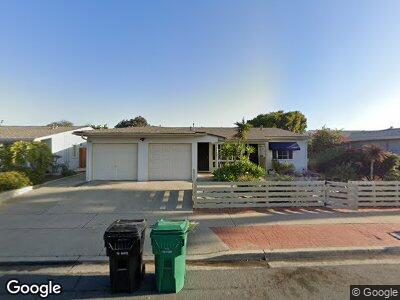
3146 Jemez Dr Unit 48 San Diego, CA 92117
Bay Ho NeighborhoodEstimated Value: $1,107,880 - $1,306,000
4
Beds
2
Baths
1,584
Sq Ft
$757/Sq Ft
Est. Value
About This Home
This home is located at 3146 Jemez Dr Unit 48, San Diego, CA 92117 and is currently estimated at $1,198,970, approximately $756 per square foot. 3146 Jemez Dr Unit 48 is a home located in San Diego County with nearby schools including Alcott Elementary School, Marston Middle School, and Clairemont High School.
Ownership History
Date
Name
Owned For
Owner Type
Purchase Details
Closed on
Feb 17, 2022
Sold by
Dershem Larry D and Dershem Thuy Hoa
Bought by
Dershem Family Trust
Current Estimated Value
Home Financials for this Owner
Home Financials are based on the most recent Mortgage that was taken out on this home.
Original Mortgage
$350,000
Outstanding Balance
$329,917
Interest Rate
3.92%
Mortgage Type
New Conventional
Estimated Equity
$823,109
Purchase Details
Closed on
Jan 31, 1997
Sold by
Douglas Dershem Larry and Thuy Hoa
Bought by
Dershem Larry D and Dershem Hoa Thuy
Purchase Details
Closed on
Jan 8, 1996
Sold by
Dershem Larry Douglas
Bought by
Dershem Larry Douglas and Dershem Hoa Thuy
Home Financials for this Owner
Home Financials are based on the most recent Mortgage that was taken out on this home.
Original Mortgage
$90,000
Interest Rate
6.73%
Create a Home Valuation Report for This Property
The Home Valuation Report is an in-depth analysis detailing your home's value as well as a comparison with similar homes in the area
Home Values in the Area
Average Home Value in this Area
Purchase History
| Date | Buyer | Sale Price | Title Company |
|---|---|---|---|
| Dershem Family Trust | -- | Accommodation/Courtesy Recordi | |
| Dershem Larry D | -- | Fidelity National Title | |
| Dershem Larry D | -- | -- | |
| Dershem Larry Douglas | -- | First American Title |
Source: Public Records
Mortgage History
| Date | Status | Borrower | Loan Amount |
|---|---|---|---|
| Open | Dershem Larry D | $350,000 | |
| Previous Owner | Dershem Hoa Thuy | $177,245 | |
| Previous Owner | Dershem Larry D | $347,500 | |
| Previous Owner | Dershem Larry D | $200,000 | |
| Previous Owner | Dershem Larry Douglas | $90,000 |
Source: Public Records
Tax History Compared to Growth
Tax History
| Year | Tax Paid | Tax Assessment Tax Assessment Total Assessment is a certain percentage of the fair market value that is determined by local assessors to be the total taxable value of land and additions on the property. | Land | Improvement |
|---|---|---|---|---|
| 2024 | $1,114 | $87,823 | $42,097 | $45,726 |
| 2023 | $1,089 | $86,102 | $41,272 | $44,830 |
| 2022 | $1,060 | $84,414 | $40,463 | $43,951 |
| 2021 | $1,053 | $82,760 | $39,670 | $43,090 |
| 2020 | $1,041 | $81,913 | $39,264 | $42,649 |
| 2019 | $1,023 | $80,308 | $38,495 | $41,813 |
| 2018 | $958 | $78,735 | $37,741 | $40,994 |
| 2017 | $935 | $77,192 | $37,001 | $40,191 |
| 2016 | $919 | $75,679 | $36,276 | $39,403 |
| 2015 | $905 | $74,544 | $35,732 | $38,812 |
| 2014 | $892 | $73,085 | $35,033 | $38,052 |
Source: Public Records
Map
Nearby Homes
- 3146-48 Jemez Dr
- 4664 Isleta Ave
- 3375 Karok Ave
- 4716 Murat Place
- 4687 Murat Ct
- 2901 Havasupai Ave
- 4786 Moraga Ave
- 2864 Havasupai Ave
- 2860 Aber St
- 4653 Leathers St
- 4471 Moraga Ave
- 3454 Oak Glen Ln
- 2772 Ariane Dr Unit 70
- 2710 Ariane Dr Unit 2
- 2742 Ariane Dr Unit 154
- 3369 Geddes Dr
- 3592 Hatteras Ave
- 3701 Tavara Cir
- 3634 Morlan St
- 5189 Argonne Ct
- 3146 Jemez Dr Unit 48
- 3136 Jemez Dr Unit 38
- 3156 Jemez Dr Unit 58
- 3138 Jemez Dr
- 3151 Luna Ave
- 3161 Luna Ave Unit 63
- 3126 Jemez Dr Unit 28
- 3141 Luna Ave Unit 43
- 3166 Jemez Dr Unit 68
- 3155 Jemez Dr
- 3145 Jemez Dr Unit 47
- 3171-73 Luna Ave
- 3135 Jemez Dr Unit 37
- 3171 Luna Ave Unit 73
- 3155 Jemez Dr
- 3131 Luna Ave Unit 33
- 3165 Jemez Dr
- 3116 Jemez Dr Unit 18
- 3125 Jemez Dr Unit 27
- 3165 Jemez Dr Unit 67