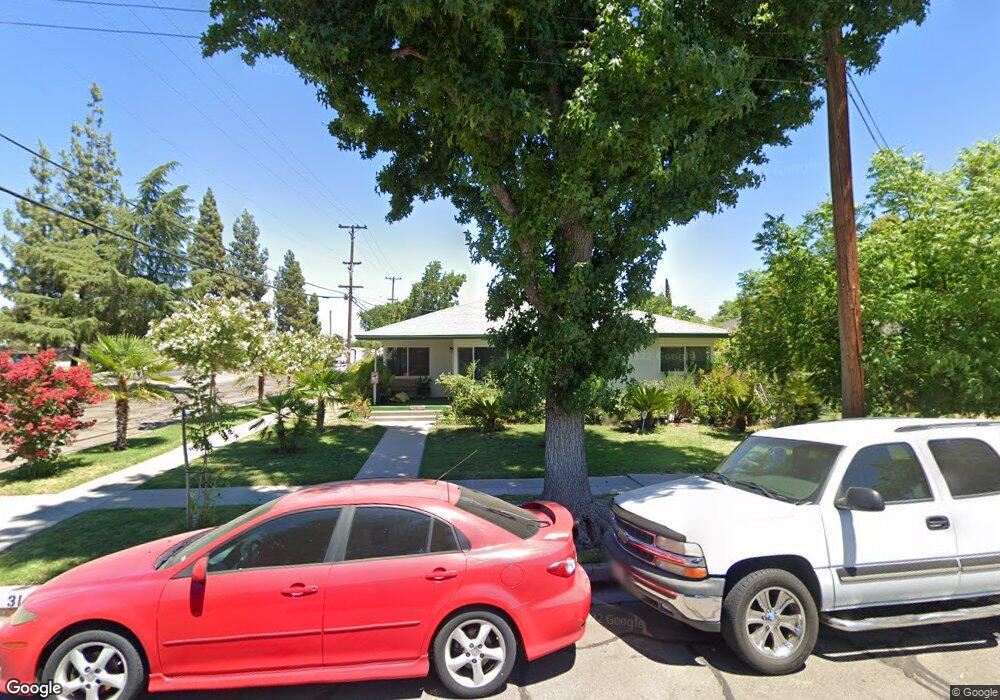
3148 N 8th St Fresno, CA 93703
McLane NeighborhoodEstimated Value: $316,000 - $354,000
2
Beds
2
Baths
1,679
Sq Ft
$202/Sq Ft
Est. Value
About This Home
This home is located at 3148 N 8th St, Fresno, CA 93703 and is currently estimated at $338,905, approximately $201 per square foot. 3148 N 8th St is a home located in Fresno County with nearby schools including Wishon Elementary School, Scandinavian Middle School, and Mclane High School.
Ownership History
Date
Name
Owned For
Owner Type
Purchase Details
Closed on
Dec 6, 2010
Sold by
Wells Fargo Bank Na
Bought by
Leon Marisela Lizarraga
Current Estimated Value
Purchase Details
Closed on
Aug 4, 2010
Sold by
Medina Salvador
Bought by
Wells Fargo Bank Na
Purchase Details
Closed on
Apr 25, 2007
Sold by
Medina Salvador
Bought by
Olivarez Danny J and Savalza Olivarez Olivia
Home Financials for this Owner
Home Financials are based on the most recent Mortgage that was taken out on this home.
Original Mortgage
$182,000
Interest Rate
6.11%
Mortgage Type
New Conventional
Purchase Details
Closed on
Sep 24, 1996
Sold by
Mooney Rita M Jackson Dolores J
Bought by
Savalza Olivia and Medina Salvador
Home Financials for this Owner
Home Financials are based on the most recent Mortgage that was taken out on this home.
Original Mortgage
$79,781
Interest Rate
7.76%
Mortgage Type
FHA
Create a Home Valuation Report for This Property
The Home Valuation Report is an in-depth analysis detailing your home's value as well as a comparison with similar homes in the area
Home Values in the Area
Average Home Value in this Area
Purchase History
| Date | Buyer | Sale Price | Title Company |
|---|---|---|---|
| Leon Marisela Lizarraga | $85,000 | Chicago Title Company | |
| Wells Fargo Bank Na | $105,462 | Accommodation | |
| Olivarez Danny J | -- | None Available | |
| Medina Salvador | -- | Financial Title Company | |
| Savalza Olivia | $80,000 | Central Title Company |
Source: Public Records
Mortgage History
| Date | Status | Borrower | Loan Amount |
|---|---|---|---|
| Previous Owner | Medina Salvador | $182,000 | |
| Previous Owner | Savalza Olivia | $79,781 | |
| Closed | Savalza Olivia | $2,215 |
Source: Public Records
Tax History Compared to Growth
Tax History
| Year | Tax Paid | Tax Assessment Tax Assessment Total Assessment is a certain percentage of the fair market value that is determined by local assessors to be the total taxable value of land and additions on the property. | Land | Improvement |
|---|---|---|---|---|
| 2025 | $1,523 | $128,105 | $38,430 | $89,675 |
| 2023 | $1,492 | $123,133 | $36,939 | $86,194 |
| 2022 | $1,470 | $120,719 | $36,215 | $84,504 |
| 2021 | $1,428 | $118,353 | $35,505 | $82,848 |
| 2020 | $1,421 | $117,140 | $35,141 | $81,999 |
| 2019 | $1,365 | $114,844 | $34,452 | $80,392 |
| 2018 | $1,334 | $112,593 | $33,777 | $78,816 |
| 2017 | $1,310 | $110,386 | $33,115 | $77,271 |
| 2016 | $1,265 | $108,222 | $32,466 | $75,756 |
| 2015 | $1,245 | $106,598 | $31,979 | $74,619 |
| 2014 | $1,221 | $104,511 | $31,353 | $73,158 |
Source: Public Records
Map
Nearby Homes
- 3803 E Shields Ave
- 3926 E Fountain Way
- 3445 N 9th St
- 3645 E Cortland Ave
- 3646 E Dayton Ave
- 3473 E Dayton Ave
- 3433 E Dayton Ave
- 3715 E Garland Ave
- 3803 E Clinton Ave
- 4002 E Dakota Ave Unit 104
- 3243 E Simpson Ave
- 3415 E Terrace Ave
- 4454 E Simpson Ave
- 3514 Mayfair Dr N
- 3004 N First St
- 2154 Norris Dr E
- 2904 N First St
- 3415 E Lansing Way
- 2042 Mayfair Dr E
- 2513 N 2nd St
- 3138 N 8th St
- 3149 N Wolters Ave
- 3139 N Wolters Ave
- 3128 N 8th St
- 3127 N Wolters Ave
- 3141 N 8th St
- 3129 N 8th St
- 3115 N Wolters Ave
- 3116 N 8th St
- 3117 N 8th St
- 3103 N Wolters Ave
- 3813 E Shields Ave
- 3146 N 7th St
- 3148 N Wolters Ave
- 3823 E Shields Ave
- 3104 N 8th St
- 3140 N Wolters Ave
- 3105 N 8th St
- 3833 E Shields Ave
- 3132 N Wolters Ave