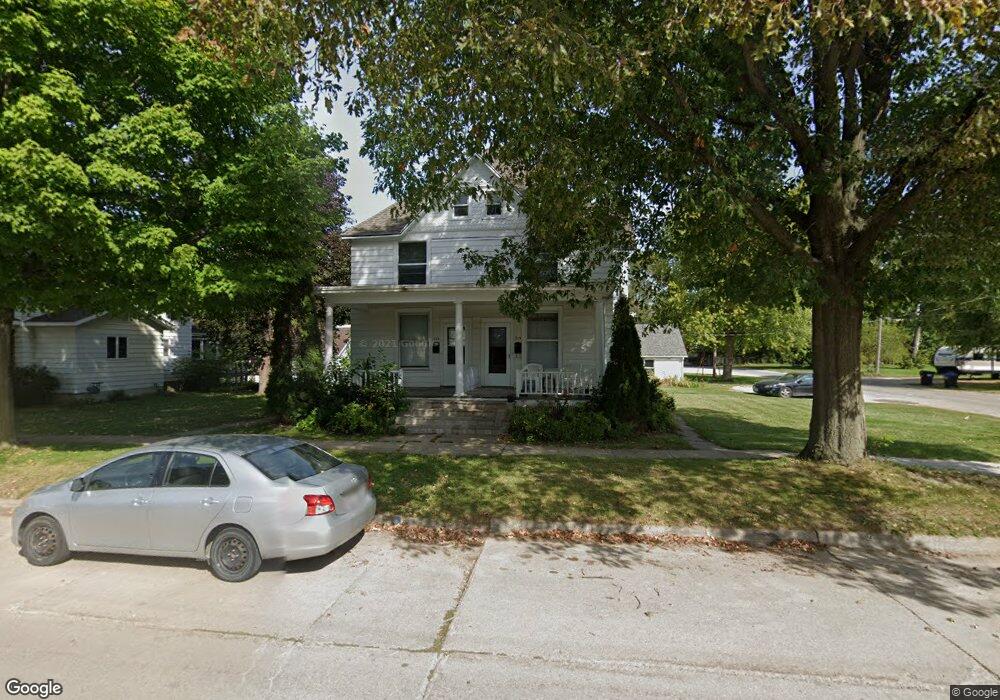
315 E 8th St Vinton, IA 52349
Estimated Value: $136,000 - $173,000
6
Beds
2
Baths
2,616
Sq Ft
$59/Sq Ft
Est. Value
About This Home
This home is located at 315 E 8th St, Vinton, IA 52349 and is currently estimated at $154,500, approximately $59 per square foot. 315 E 8th St is a home with nearby schools including Tilford Elementary School, Vinton-Shellsburg Middle School, and Vinton-Shellsburg High School.
Ownership History
Date
Name
Owned For
Owner Type
Purchase Details
Closed on
Feb 19, 2026
Sold by
Christoph Chadwick and Christoph Kristine L
Bought by
Welcome Home Properties Llc
Current Estimated Value
Purchase Details
Closed on
Dec 20, 2017
Sold by
Hummel Apts Inc
Bought by
Christoph Chadwick J and Christoph Kristine L
Home Financials for this Owner
Home Financials are based on the most recent Mortgage that was taken out on this home.
Original Mortgage
$450,000
Interest Rate
3.92%
Mortgage Type
New Conventional
Create a Home Valuation Report for This Property
The Home Valuation Report is an in-depth analysis detailing your home's value as well as a comparison with similar homes in the area
Home Values in the Area
Average Home Value in this Area
Purchase History
| Date | Buyer | Sale Price | Title Company |
|---|---|---|---|
| Welcome Home Properties Llc | -- | None Listed On Document | |
| Christoph Chadwick J | $540,500 | None Available |
Source: Public Records
Mortgage History
| Date | Status | Borrower | Loan Amount |
|---|---|---|---|
| Previous Owner | Christoph Chadwick J | $450,000 |
Source: Public Records
Tax History
| Year | Tax Paid | Tax Assessment Tax Assessment Total Assessment is a certain percentage of the fair market value that is determined by local assessors to be the total taxable value of land and additions on the property. | Land | Improvement |
|---|---|---|---|---|
| 2025 | $2,228 | $131,400 | $16,800 | $114,600 |
| 2024 | $2,228 | $118,900 | $16,100 | $102,800 |
| 2023 | $2,062 | $118,900 | $16,100 | $102,800 |
| 2022 | $2,116 | $95,800 | $12,900 | $82,900 |
| 2021 | $2,116 | $95,800 | $12,900 | $82,900 |
| 2020 | $1,854 | $85,700 | $14,300 | $71,400 |
| 2019 | $2,252 | $85,700 | $14,300 | $71,400 |
| 2018 | $2,186 | $102,700 | $13,800 | $88,900 |
| 2017 | $2,106 | $102,700 | $13,800 | $88,900 |
| 2016 | $2,072 | $96,000 | $12,900 | $83,100 |
| 2015 | $2,072 | $96,000 | $12,900 | $83,100 |
| 2014 | $1,990 | $92,000 | $0 | $0 |
Source: Public Records
Map
Nearby Homes
Your Personal Tour Guide
Ask me questions while you tour the home.