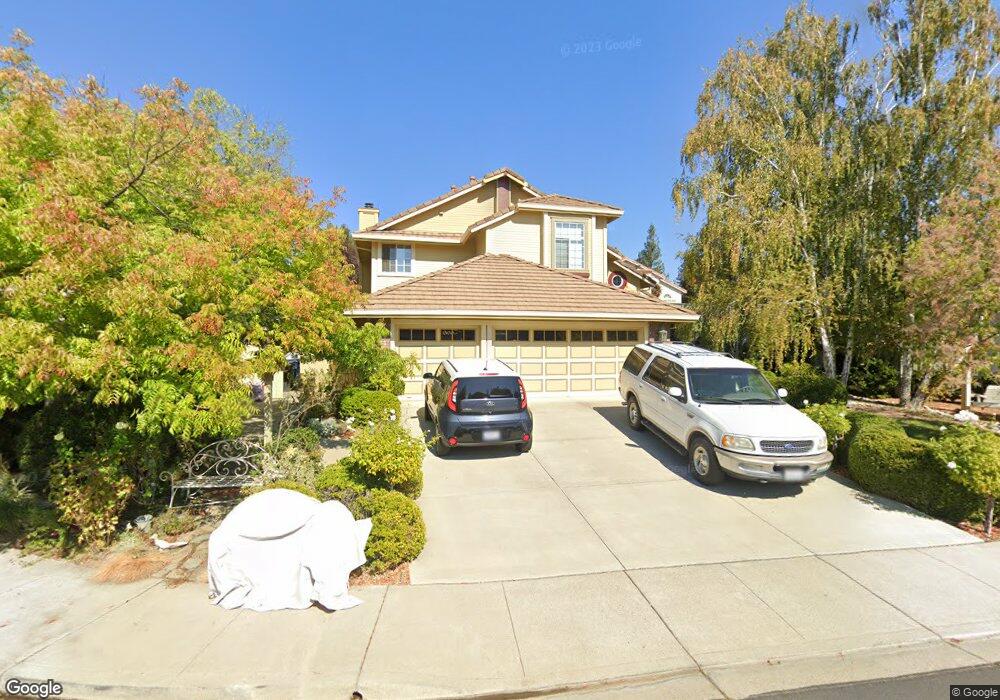
3150 Salisbury Ct Livermore, CA 94551
Portola Glen NeighborhoodEstimated Value: $1,604,201 - $1,804,000
4
Beds
3
Baths
2,714
Sq Ft
$625/Sq Ft
Est. Value
About This Home
This home is located at 3150 Salisbury Ct, Livermore, CA 94551 and is currently estimated at $1,696,050, approximately $624 per square foot. 3150 Salisbury Ct is a home located in Alameda County with nearby schools including Junction Avenue K-8 School, Livermore High School, and Valley Montessori School.
Ownership History
Date
Name
Owned For
Owner Type
Purchase Details
Closed on
Mar 27, 2023
Sold by
King Allan Pg
Bought by
King Allan P G and King Jeani Laraine
Current Estimated Value
Purchase Details
Closed on
Mar 1, 2012
Sold by
Smith Jeani Laraine and Smith Jeani L
Bought by
King Allan P G and Smith Jeani Laraine
Home Financials for this Owner
Home Financials are based on the most recent Mortgage that was taken out on this home.
Original Mortgage
$401,000
Interest Rate
3.92%
Mortgage Type
New Conventional
Purchase Details
Closed on
May 14, 2002
Sold by
Smith Jeani L
Bought by
Smith Jeani L
Purchase Details
Closed on
Sep 23, 2001
Sold by
Smith David Brian
Bought by
Smith Jeani Laraine
Purchase Details
Closed on
Nov 28, 1994
Sold by
Warmington Enterprises L P
Bought by
Smith Brian David and Smith Jeani Laraine
Home Financials for this Owner
Home Financials are based on the most recent Mortgage that was taken out on this home.
Original Mortgage
$264,855
Interest Rate
9.1%
Create a Home Valuation Report for This Property
The Home Valuation Report is an in-depth analysis detailing your home's value as well as a comparison with similar homes in the area
Home Values in the Area
Average Home Value in this Area
Purchase History
We collect this data history from publicly available records. To have your information removed, we recommend requesting removal directly through your county’s website.
| Date | Buyer | Sale Price | Title Company |
|---|---|---|---|
| King Allan P G | -- | None Listed On Document | |
| King Allan P G | -- | Chicago Title Company | |
| Smith Jeani L | -- | -- | |
| Smith Jeani Laraine | -- | -- | |
| Smith Brian David | $353,500 | Northwestern Title Company |
Source: Public Records
Mortgage History
We collect this data history from publicly available records. To have your information removed, we recommend requesting removal directly through your county’s website.
| Date | Status | Borrower | Loan Amount |
|---|---|---|---|
| Previous Owner | King Allan P G | $401,000 | |
| Previous Owner | Smith Brian David | $264,855 |
Source: Public Records
Tax History
| Year | Tax Paid | Tax Assessment Tax Assessment Total Assessment is a certain percentage of the fair market value that is determined by local assessors to be the total taxable value of land and additions on the property. | Land | Improvement |
|---|---|---|---|---|
| 2025 | $8,779 | $586,070 | $193,155 | $399,915 |
| 2024 | $8,779 | $574,442 | $189,368 | $392,074 |
| 2023 | $8,624 | $570,044 | $185,656 | $384,388 |
| 2022 | $8,447 | $551,868 | $182,016 | $376,852 |
| 2021 | $7,395 | $540,911 | $178,447 | $369,464 |
| 2020 | $7,685 | $542,294 | $176,618 | $365,676 |
| 2019 | $7,792 | $531,662 | $173,155 | $358,507 |
| 2018 | $7,537 | $521,238 | $169,760 | $351,478 |
| 2017 | $7,256 | $511,019 | $166,432 | $344,587 |
| 2016 | $7,003 | $501,002 | $163,170 | $337,832 |
| 2015 | $6,603 | $493,478 | $160,719 | $332,759 |
| 2014 | $6,496 | $483,813 | $157,571 | $326,242 |
Source: Public Records
Map
Nearby Homes
- 2964 Kennedy St
- 2950 Kelly St
- 2746 Kelly St
- 3370 Gardella Plaza
- 330 Scott St
- 2673 Kennedy St
- 112 Martin Ave
- 0 Gardella Plaza
- 607 Morgan Common
- 3941 Portola Common Unit 4
- 3941 Portola Common Unit 6
- 256 Plum Tree St
- 112 Apricot St
- 2797 Patcham Common
- 3610 Madeira Way
- 2676 3rd St Unit 1701
- 3877 Silver Oaks Way
- 3983 Inverness Common
- 385 Kensington Common
- 2659 3rd St
- 3194 Salisbury Ct
- 3138 Salisbury Ct
- 637 Yorkshire Ct
- 675 Yorkshire Ct
- 629 Yorkshire Ct
- 3116 Salisbury Ct
- 3147 Salisbury Ct
- 621 Yorkshire Ct
- 3189 Salisbury Ct
- 3125 Salisbury Ct
- 3243 Edinburgh Dr
- 3113 Salisbury Ct
- 3265 Edinburgh Dr
- 3221 Edinburgh Dr
- 525 Yorkshire Dr
- 533 Yorkshire Dr
- 517 Yorkshire Dr
- 509 Yorkshire Dr
- 644 Yorkshire Ct
- 3209 Edinburgh Dr
Your Personal Tour Guide
Ask me questions while you tour the home.