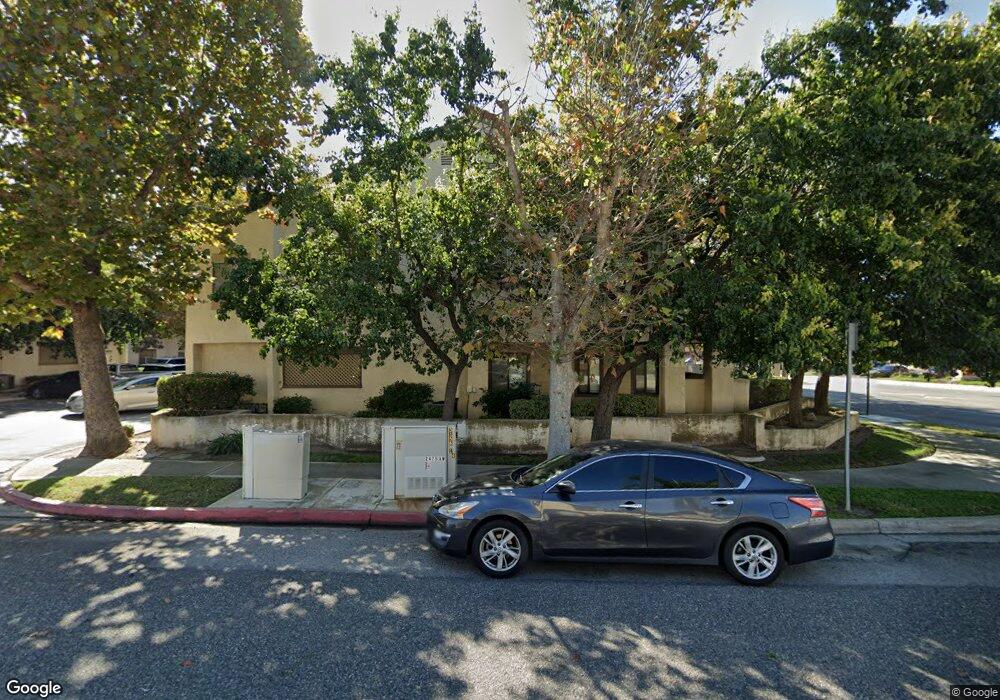
3156 Darby St Unit 11 Simi Valley, CA 93063
Central Simi Valley NeighborhoodEstimated Value: $446,550 - $450,000
2
Beds
1
Bath
1,114
Sq Ft
$403/Sq Ft
Est. Value
About This Home
This home is located at 3156 Darby St Unit 11, Simi Valley, CA 93063 and is currently estimated at $448,388, approximately $402 per square foot. 3156 Darby St Unit 11 is a home located in Ventura County with nearby schools including Sycamore Elementary School, Hillside Middle School, and Simi Valley High School.
Ownership History
Date
Name
Owned For
Owner Type
Purchase Details
Closed on
Mar 23, 2022
Sold by
Arnold Karen L
Bought by
Arnold Karen L
Current Estimated Value
Home Financials for this Owner
Home Financials are based on the most recent Mortgage that was taken out on this home.
Original Mortgage
$280,000
Outstanding Balance
$257,145
Interest Rate
3%
Mortgage Type
New Conventional
Estimated Equity
$191,243
Purchase Details
Closed on
Feb 2, 2021
Sold by
Walker Elizabeth Catherine
Bought by
Graf Betty J
Purchase Details
Closed on
Nov 19, 2020
Sold by
Graf Betty J and Fosdick Janet A
Bought by
Arnold Karen L
Home Financials for this Owner
Home Financials are based on the most recent Mortgage that was taken out on this home.
Original Mortgage
$280,000
Interest Rate
2.67%
Mortgage Type
New Conventional
Purchase Details
Closed on
May 6, 2013
Sold by
Riordan John P
Bought by
Riordan John P
Home Financials for this Owner
Home Financials are based on the most recent Mortgage that was taken out on this home.
Original Mortgage
$52,601
Interest Rate
3.5%
Mortgage Type
New Conventional
Purchase Details
Closed on
Jul 30, 1999
Sold by
Riordan John P
Bought by
The John P Riordan Revocable Trust and Riordan John P
Purchase Details
Closed on
Oct 5, 1995
Sold by
Walker Elizabeth C
Bought by
Walker Elizabeth C
Create a Home Valuation Report for This Property
The Home Valuation Report is an in-depth analysis detailing your home's value as well as a comparison with similar homes in the area
Home Values in the Area
Average Home Value in this Area
Purchase History
| Date | Buyer | Sale Price | Title Company |
|---|---|---|---|
| Arnold Karen L | -- | Consumers Title | |
| Graf Betty J | -- | -- | |
| Arnold Karen L | $350,000 | Chicago Title Co | |
| Riordan John P | -- | None Available | |
| The John P Riordan Revocable Trust | -- | -- | |
| Walker Elizabeth C | -- | -- |
Source: Public Records
Mortgage History
| Date | Status | Borrower | Loan Amount |
|---|---|---|---|
| Open | Arnold Karen L | $280,000 | |
| Previous Owner | Arnold Karen L | $280,000 | |
| Previous Owner | Riordan John P | $52,601 |
Source: Public Records
Tax History Compared to Growth
Tax History
| Year | Tax Paid | Tax Assessment Tax Assessment Total Assessment is a certain percentage of the fair market value that is determined by local assessors to be the total taxable value of land and additions on the property. | Land | Improvement |
|---|---|---|---|---|
| 2025 | $4,571 | $378,850 | $246,254 | $132,596 |
| 2024 | $4,571 | $371,422 | $241,425 | $129,997 |
| 2023 | $4,298 | $364,140 | $236,691 | $127,449 |
| 2022 | $4,281 | $357,000 | $232,050 | $124,950 |
| 2021 | $2,114 | $150,598 | $62,918 | $87,680 |
| 2020 | $2,060 | $149,056 | $62,274 | $86,782 |
| 2019 | $1,959 | $146,134 | $61,053 | $85,081 |
| 2018 | $1,933 | $143,269 | $59,856 | $83,413 |
| 2017 | $1,883 | $140,461 | $58,683 | $81,778 |
| 2016 | $1,796 | $137,708 | $57,533 | $80,175 |
| 2015 | $1,751 | $135,642 | $56,670 | $78,972 |
| 2014 | -- | $132,987 | $55,561 | $77,426 |
Source: Public Records
Map
Nearby Homes
- 3192 Darby St Unit 113
- 3210 Darby St Unit 102
- 3306 Darby St Unit 402
- 2508 Glenhurst Ct
- 2358 Medina Ave
- 2579 Little Rock Ln
- 2433 Medina Ave
- 2621 Bitternut Cir
- 2648 Georgette Place
- 3417 Highwood Ct Unit 148
- 3476 Lockwood Ct Unit 33
- 3434 Highwood Ct Unit 183
- 3082 Galena Ave
- 3445 Highwood Ct Unit 128
- 3458 Highwood Ct Unit 198
- 3474 Highwood Ct Unit 80
- 2727 Reservoir Dr
- 2158 Waldo St
- 3010 Tallahassee Ln
- 3049 Tallahassee Ln
- 3156 Darby St Unit 211
- 3156 Darby St Unit 212
- 3156 Darby St Unit 112
- 3162 Darby St Unit 110
- 3162 Darby St Unit 209
- 3162 Darby St Unit 109
- 3162 Darby St Unit 210
- 3192 Darby St Unit 213
- 3192 Darby St Unit 214
- 3192 Darby St Unit 114
- 3186 Darby St Unit 220
- 3186 Darby St Unit 120
- 3186 Darby St Unit 219
- 3186 Darby St Unit 119
- 3168 Darby St Unit 207
- 3168 Darby St Unit 107
- 3168 Darby St Unit 208
- 2475 Abbeywood Ct
- 3084 Harrison Ln
- 2481 Abbeywood Ct