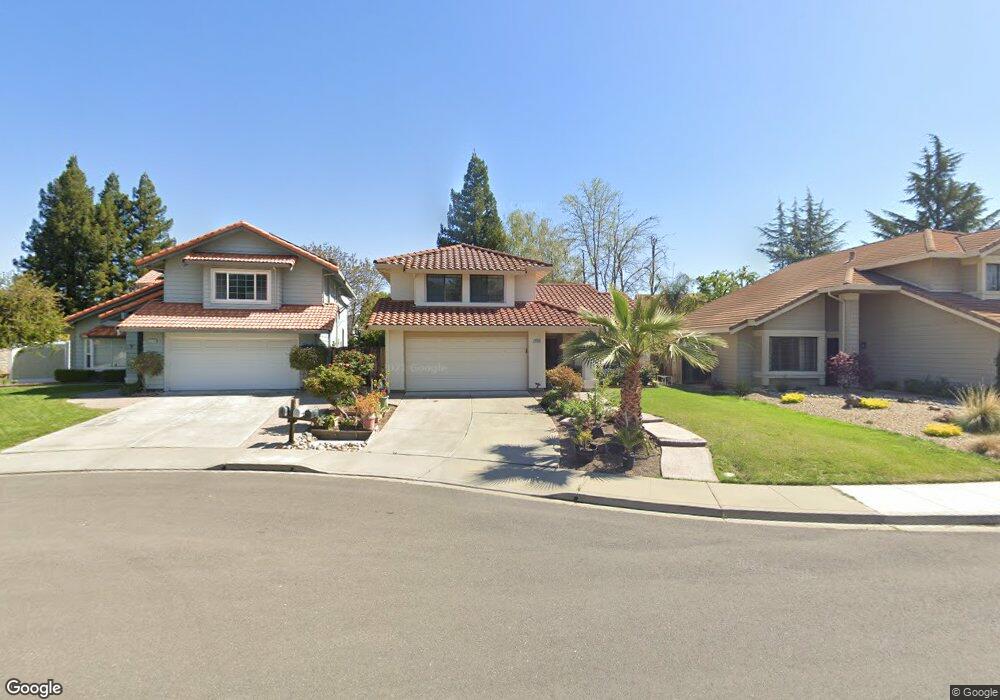
3158 Paseo Robles Pleasanton, CA 94566
Valley Trails NeighborhoodEstimated Value: $1,918,789 - $2,093,000
4
Beds
3
Baths
2,212
Sq Ft
$899/Sq Ft
Est. Value
About This Home
This home is located at 3158 Paseo Robles, Pleasanton, CA 94566 and is currently estimated at $1,988,197, approximately $898 per square foot. 3158 Paseo Robles is a home located in Alameda County with nearby schools including Donlon Elementary School, Thomas S. Hart Middle School, and Foothill High School.
Ownership History
Date
Name
Owned For
Owner Type
Purchase Details
Closed on
Jul 16, 2021
Sold by
Patil Narayan and Patil Meena
Bought by
Patil Meena and Patil Narayan
Current Estimated Value
Purchase Details
Closed on
Jan 16, 2008
Sold by
Patil Narayan D and Patil Meena
Bought by
Patil Narayan D and Patil Meena
Home Financials for this Owner
Home Financials are based on the most recent Mortgage that was taken out on this home.
Original Mortgage
$417,000
Outstanding Balance
$262,576
Interest Rate
6.2%
Mortgage Type
Purchase Money Mortgage
Estimated Equity
$1,725,621
Purchase Details
Closed on
Dec 13, 2007
Sold by
Yu Yeung S and Yu Wanda W H
Bought by
Patil Narayan D and Patil Meena
Home Financials for this Owner
Home Financials are based on the most recent Mortgage that was taken out on this home.
Original Mortgage
$417,000
Outstanding Balance
$262,576
Interest Rate
6.2%
Mortgage Type
Purchase Money Mortgage
Estimated Equity
$1,725,621
Create a Home Valuation Report for This Property
The Home Valuation Report is an in-depth analysis detailing your home's value as well as a comparison with similar homes in the area
Home Values in the Area
Average Home Value in this Area
Purchase History
| Date | Buyer | Sale Price | Title Company |
|---|---|---|---|
| Patil Meena | -- | None Available | |
| Patil Narayan D | -- | Stewart Title Bats | |
| Patil Narayan D | $810,000 | Stewart Title Bats |
Source: Public Records
Mortgage History
| Date | Status | Borrower | Loan Amount |
|---|---|---|---|
| Open | Patil Narayan D | $417,000 |
Source: Public Records
Tax History Compared to Growth
Tax History
| Year | Tax Paid | Tax Assessment Tax Assessment Total Assessment is a certain percentage of the fair market value that is determined by local assessors to be the total taxable value of land and additions on the property. | Land | Improvement |
|---|---|---|---|---|
| 2025 | $12,225 | $1,056,877 | $319,163 | $744,714 |
| 2024 | $12,225 | $1,036,020 | $312,906 | $730,114 |
| 2023 | $12,084 | $1,022,575 | $306,772 | $715,803 |
| 2022 | $11,448 | $995,528 | $300,758 | $701,770 |
| 2021 | $11,154 | $975,877 | $294,863 | $688,014 |
| 2020 | $11,011 | $972,801 | $291,840 | $680,961 |
| 2019 | $11,144 | $953,734 | $286,120 | $667,614 |
| 2018 | $10,918 | $935,038 | $280,511 | $654,527 |
| 2017 | $10,638 | $916,708 | $275,012 | $641,696 |
| 2016 | $9,823 | $898,734 | $269,620 | $629,114 |
| 2015 | $9,639 | $885,240 | $265,572 | $619,668 |
| 2014 | $9,811 | $867,906 | $260,372 | $607,534 |
Source: Public Records
Map
Nearby Homes
- 3162 Paseo Robles
- 3110 Paseo Robles
- 6450 Calle Esperanza
- 3636 Shenandoah Ct
- 6083 Corte Montanas
- 5988 Corte Cerritos
- 6056 Corte Encinas
- 3530 Carlsbad Ct
- 3702 Gettysburg Ct N
- 5995 Via Del Cielo
- 6686 Via San Blas
- 7444 Pecan Ct
- 2545 Corte Rivera
- 7758 Forsythia Ct
- 6355 Singletree Way
- 4336 Muirwood Dr
- 7606 Desertwood Ln
- 4421 Muirwood Dr
- 5550 Black Ave
- 4504 Muirwood Dr
- 3160 Paseo Robles
- 3156 Paseo Robles
- 3190 Paseo Granada
- 3154 Paseo Robles
- 6561 Calle de la Mancha
- 3131 Paseo Robles
- 3152 Paseo Robles
- 3164 Paseo Robles
- 7601 Paseo Santa Cruz
- 3182 Paseo Granada
- 3150 Paseo Robles
- 3016 Calle de la Mesa
- 3129 Paseo Robles
- 7613 Paseo Santa Cruz
- 6553 Calle de la Mancha
- 3148 Paseo Robles
- 3014 Calle de la Mesa
- 6702 Paseo Catalina
- 3127 Paseo Robles
- 7625 Paseo Santa Cruz