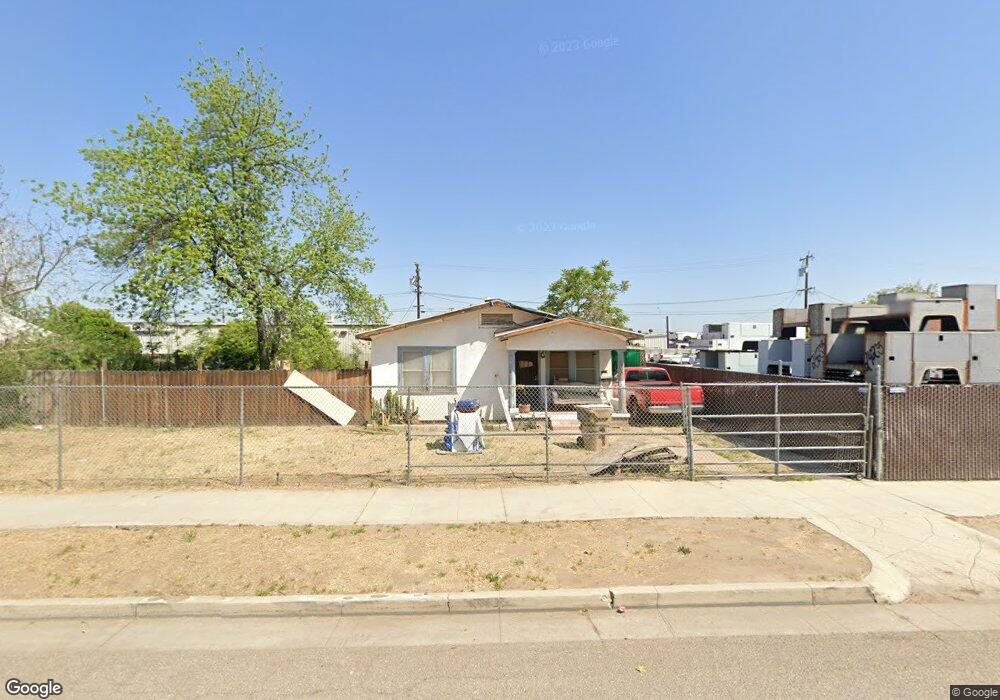
316 E 21st St Bakersfield, CA 93305
East Bakersfield NeighborhoodEstimated Value: $159,000 - $169,185
3
Beds
1
Bath
1,016
Sq Ft
$162/Sq Ft
Est. Value
About This Home
This home is located at 316 E 21st St, Bakersfield, CA 93305 and is currently estimated at $164,093, approximately $161 per square foot. 316 E 21st St is a home located in Kern County with nearby schools including Longfellow Elementary School, Washington Middle School, and Bakersfield High School.
Ownership History
Date
Name
Owned For
Owner Type
Purchase Details
Closed on
Jul 10, 2023
Sold by
Ras California Llc
Bought by
Douglass Properties Llc
Current Estimated Value
Purchase Details
Closed on
Mar 29, 2023
Sold by
Salazar Adan
Bought by
Ras California Llc
Home Financials for this Owner
Home Financials are based on the most recent Mortgage that was taken out on this home.
Original Mortgage
$350,000
Interest Rate
6.65%
Mortgage Type
New Conventional
Purchase Details
Closed on
Jul 29, 2009
Sold by
Sarmento Socorro
Bought by
Salazar Adam
Purchase Details
Closed on
Jun 24, 2003
Sold by
Salazar Adam
Bought by
Salazar Adam and Sarmento Socorro
Purchase Details
Closed on
Apr 7, 2003
Sold by
Canfield Randy and Kou Sharon Jau
Bought by
Salazar Adam
Home Financials for this Owner
Home Financials are based on the most recent Mortgage that was taken out on this home.
Original Mortgage
$71,725
Interest Rate
5.84%
Purchase Details
Closed on
Feb 28, 1994
Sold by
Canfield Lee
Bought by
Canfield Lee
Create a Home Valuation Report for This Property
The Home Valuation Report is an in-depth analysis detailing your home's value as well as a comparison with similar homes in the area
Home Values in the Area
Average Home Value in this Area
Purchase History
We collect this data history from publicly available records. To have your information removed, we recommend requesting removal directly through your county’s website.
| Date | Buyer | Sale Price | Title Company |
|---|---|---|---|
| Douglass Properties Llc | $153,000 | Chicago Title | |
| Ras California Llc | $80,000 | Chicago Title | |
| Salazar Adam | -- | None Available | |
| Salazar Adam | -- | -- | |
| Salazar Adam | $38,000 | Commonwealth Title | |
| Canfield Lee | -- | -- |
Source: Public Records
Mortgage History
We collect this data history from publicly available records. To have your information removed, we recommend requesting removal directly through your county’s website.
| Date | Status | Borrower | Loan Amount |
|---|---|---|---|
| Previous Owner | Ras California Llc | $350,000 | |
| Previous Owner | Salazar Adam | $71,725 |
Source: Public Records
Tax History
| Year | Tax Paid | Tax Assessment Tax Assessment Total Assessment is a certain percentage of the fair market value that is determined by local assessors to be the total taxable value of land and additions on the property. | Land | Improvement |
|---|---|---|---|---|
| 2025 | $2,508 | $30,600 | $30,600 | -- |
| 2024 | $2,508 | $153,000 | $30,000 | $123,000 |
| 2023 | $1,840 | $105,084 | $62,636 | $42,448 |
| 2022 | $1,786 | $103,024 | $61,408 | $41,616 |
| 2021 | $1,683 | $101,004 | $60,204 | $40,800 |
| 2020 | $1,647 | $99,969 | $59,587 | $40,382 |
| 2019 | $1,613 | $99,969 | $59,587 | $40,382 |
| 2018 | $1,577 | $96,089 | $57,274 | $38,815 |
| 2017 | $1,562 | $94,000 | $24,000 | $70,000 |
| 2016 | $1,346 | $83,000 | $21,000 | $62,000 |
| 2015 | $1,336 | $82,000 | $21,000 | $61,000 |
| 2014 | $1,135 | $65,000 | $16,000 | $49,000 |
Source: Public Records
Map
Nearby Homes
- 410 E 21st St
- 426 E 18th & 600 Tulare St
- 215 E 18th St
- 415 E 18th St
- 1736 Union Ave
- 223 Monterey St
- 618 Dolores St
- 1033 Kern St
- 217 Niles Place
- 310 Chico St
- 518 Monterey St
- 429 Niles St
- 1124 Baker St
- 410 Niles St
- 804 Kentucky St
- 524 21st St
- 821 Kentucky St Unit 823
- 615 Butte St
- 915 E 21st St
- 200 Oregon St
Your Personal Tour Guide
Ask me questions while you tour the home.