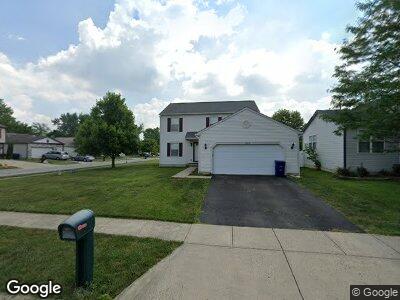
3160 Framingham Cir Columbus, OH 43224
Framingham NeighborhoodEstimated Value: $279,827 - $305,000
4
Beds
3
Baths
1,768
Sq Ft
$166/Sq Ft
Est. Value
About This Home
This home is located at 3160 Framingham Cir, Columbus, OH 43224 and is currently estimated at $292,707, approximately $165 per square foot. 3160 Framingham Cir is a home located in Franklin County with nearby schools including Innis Elementary School, Mifflin Middle School, and Mifflin High School.
Ownership History
Date
Name
Owned For
Owner Type
Purchase Details
Closed on
Oct 10, 2003
Sold by
Hud
Bought by
Sanders Sandy R
Current Estimated Value
Home Financials for this Owner
Home Financials are based on the most recent Mortgage that was taken out on this home.
Original Mortgage
$90,000
Interest Rate
6.04%
Mortgage Type
Purchase Money Mortgage
Purchase Details
Closed on
Dec 27, 2002
Sold by
Walker Leslie G and Chase Manhattan Mortgage Corp
Bought by
Hud
Purchase Details
Closed on
Oct 1, 1999
Sold by
Rockford Homes Inc
Bought by
Walker Leslie G
Home Financials for this Owner
Home Financials are based on the most recent Mortgage that was taken out on this home.
Original Mortgage
$124,277
Interest Rate
7.83%
Purchase Details
Closed on
May 11, 1999
Sold by
Columbus Housing Partnership Inc
Bought by
Rockford Homes Inc
Purchase Details
Closed on
Dec 1, 1986
Create a Home Valuation Report for This Property
The Home Valuation Report is an in-depth analysis detailing your home's value as well as a comparison with similar homes in the area
Home Values in the Area
Average Home Value in this Area
Purchase History
| Date | Buyer | Sale Price | Title Company |
|---|---|---|---|
| Sanders Sandy R | $112,500 | Lakeside Title & Escrow Agen | |
| Hud | $95,000 | -- | |
| Walker Leslie G | $124,400 | Title First Agency Inc | |
| Rockford Homes Inc | $18,500 | Title First Agency Inc | |
| -- | -- | -- |
Source: Public Records
Mortgage History
| Date | Status | Borrower | Loan Amount |
|---|---|---|---|
| Open | Sanders Willis | $102,000 | |
| Closed | Sanders Willis | $117,000 | |
| Closed | Sanders Sandy R | $90,000 | |
| Previous Owner | Walker Leslie G | $124,277 |
Source: Public Records
Tax History Compared to Growth
Tax History
| Year | Tax Paid | Tax Assessment Tax Assessment Total Assessment is a certain percentage of the fair market value that is determined by local assessors to be the total taxable value of land and additions on the property. | Land | Improvement |
|---|---|---|---|---|
| 2024 | $3,277 | $73,010 | $16,450 | $56,560 |
| 2023 | $3,235 | $73,010 | $16,450 | $56,560 |
| 2022 | $2,571 | $49,570 | $7,670 | $41,900 |
| 2021 | $2,576 | $49,570 | $7,670 | $41,900 |
| 2020 | $2,579 | $49,570 | $7,670 | $41,900 |
| 2019 | $2,376 | $39,170 | $6,130 | $33,040 |
| 2018 | $1,186 | $39,170 | $6,130 | $33,040 |
| 2017 | $2,286 | $39,170 | $6,130 | $33,040 |
| 2016 | $2,198 | $33,180 | $8,260 | $24,920 |
| 2015 | $998 | $33,180 | $8,260 | $24,920 |
| 2014 | $2,000 | $33,180 | $8,260 | $24,920 |
| 2013 | $1,161 | $39,060 | $9,730 | $29,330 |
Source: Public Records
Map
Nearby Homes
- 2495 Hingham Ln
- 3126 Dedham St
- 2525 Dexham Ct
- 3310 Framington Dr
- 2322 Mecca Rd
- 2270 Albert Ave
- 2858 Woodland Ave
- 3137 Westerville Rd Unit 44
- 3137 Westerville Rd Unit 37
- 3137 Westerville Rd Unit 36
- 3497 Hillcreek Ct
- 2559 Milford Ave
- 3484 Sweetday St
- 1980 Oakland Park Ave
- 2789 Berrell Ave
- 1865 Agler Rd Unit 1867
- 2100 Aberdeen Ave
- 1794 Audrey Rd
- 2154 Minnesota Ave
- 3073 Kola Way
- 3160 Framingham Cir
- 3152 Framingham Cir
- 3153 Mystic Ct
- 3146 Framingham Cir
- 3145 Mystic Ct
- 2464 Niantic Dr
- 2470 Niantic Dr
- 3176 Boyleston Blvd
- 3139 Mystic Ct
- 3140 Framingham Cir
- 3159 Framingham Cir
- 2478 Niantic Dr
- 3153 Framingham Cir
- 3147 Framingham Cir
- 3131 Mystic Ct
- 3184 Boyleston Blvd
- 2486 Niantic Dr
- 3134 Framingham Cir
- 3141 Framingham Cir
- 2479 Hingham Ln