3161 Arnie Rd Custer, WA 98240
Estimated Value: $951,816 - $1,073,000
4
Beds
3
Baths
3,924
Sq Ft
$257/Sq Ft
Est. Value
About This Home
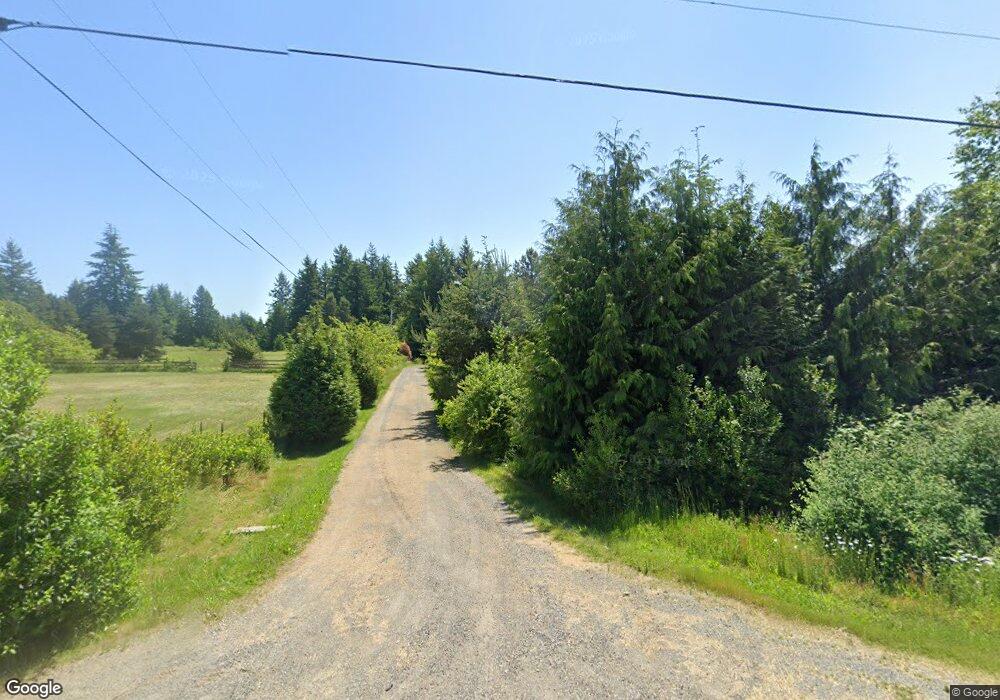
This home is located at 3161 Arnie Rd, Custer, WA 98240 and is currently estimated at $1,010,204, approximately $257 per square foot. 3161 Arnie Rd is a home located in Whatcom County with nearby schools including Custer Elementary School, Horizon Middle School, and Ferndale High School.
Ownership History
Date
Name
Owned For
Owner Type
Purchase Details
Closed on
Jan 4, 2012
Sold by
Wolter Kevin J
Bought by
Wolter Kevin John and Delacourt Wolter Natascha
Current Estimated Value
Purchase Details
Closed on
Aug 6, 2010
Sold by
Wolter Natascha Delacourt
Bought by
Wolter Kevin J
Home Financials for this Owner
Home Financials are based on the most recent Mortgage that was taken out on this home.
Original Mortgage
$369,030
Interest Rate
4.25%
Mortgage Type
FHA
Purchase Details
Closed on
May 8, 2009
Sold by
Dryden Glen Y and West Dryden Colleen
Bought by
Ct Residential Note/Reo Pool Llc
Purchase Details
Closed on
Aug 16, 2006
Sold by
Feldmann Dana J and Feldmann Marsha J
Bought by
Dryden Glen and West Colleen
Home Financials for this Owner
Home Financials are based on the most recent Mortgage that was taken out on this home.
Original Mortgage
$432,000
Interest Rate
8.74%
Mortgage Type
Balloon
Create a Home Valuation Report for This Property
The Home Valuation Report is an in-depth analysis detailing your home's value as well as a comparison with similar homes in the area
Home Values in the Area
Average Home Value in this Area
Purchase History
| Date | Buyer | Sale Price | Title Company |
|---|---|---|---|
| Wolter Kevin John | $371,926 | None Available | |
| Wolter Kevin J | -- | First American Title Ins | |
| Wolter Kevin J | $374,280 | First American Title Ins | |
| Ct Residential Note/Reo Pool Llc | $419,000 | Chicago Title Insurance | |
| Dryden Glen | $540,280 | Chicago Title Insurance |
Source: Public Records
Mortgage History
| Date | Status | Borrower | Loan Amount |
|---|---|---|---|
| Previous Owner | Wolter Kevin J | $369,030 | |
| Previous Owner | Dryden Glen | $432,000 |
Source: Public Records
Tax History
| Year | Tax Paid | Tax Assessment Tax Assessment Total Assessment is a certain percentage of the fair market value that is determined by local assessors to be the total taxable value of land and additions on the property. | Land | Improvement |
|---|---|---|---|---|
| 2025 | $6,767 | $860,728 | $386,320 | $474,408 |
| 2024 | $6,445 | $860,728 | $386,320 | $474,408 |
| 2023 | $6,445 | $889,062 | $432,900 | $456,162 |
| 2022 | $6,339 | $871,775 | $314,608 | $557,167 |
| 2021 | $5,911 | $691,880 | $249,688 | $442,192 |
| 2020 | $6,104 | $586,337 | $211,599 | $374,738 |
| 2019 | $4,837 | $542,900 | $195,923 | $346,977 |
| 2018 | $5,698 | $494,517 | $178,462 | $316,055 |
| 2017 | $5,012 | $445,511 | $160,777 | $284,734 |
| 2016 | $4,987 | $413,965 | $164,850 | $249,115 |
| 2015 | $4,822 | $413,965 | $164,850 | $249,115 |
| 2014 | -- | $389,347 | $155,046 | $234,301 |
| 2013 | -- | $381,077 | $151,753 | $229,324 |
Source: Public Records
Map
Nearby Homes
- 8225 Peace Park Dr
- 0 Portal Way
- 0 Bay Rd Unit NWM2489001
- 0 Valley View Lot 2 Rd Unit NWM2208210
- 0 Willeys Lake Rd Unit NWM2442375
- 7475 Valley View Rd
- 8383 Custer School Rd
- 7067 Yukon Way
- 0 Grandview Rd Unit NWM2386341
- 8306 Portal Way
- 8085 Audra Ln
- 3883 Everett Ln
- 3145 Brown Rd
- 4230 Bay Rd
- 7992 Carson Rd
- 4257 Cody Rd
- 7125 Kickerville Rd
- 2265 Grandview Rd
- 2966 Sweet Gum Loop
- 8741 Delta Line Rd
Your Personal Tour Guide
Ask me questions while you tour the home.