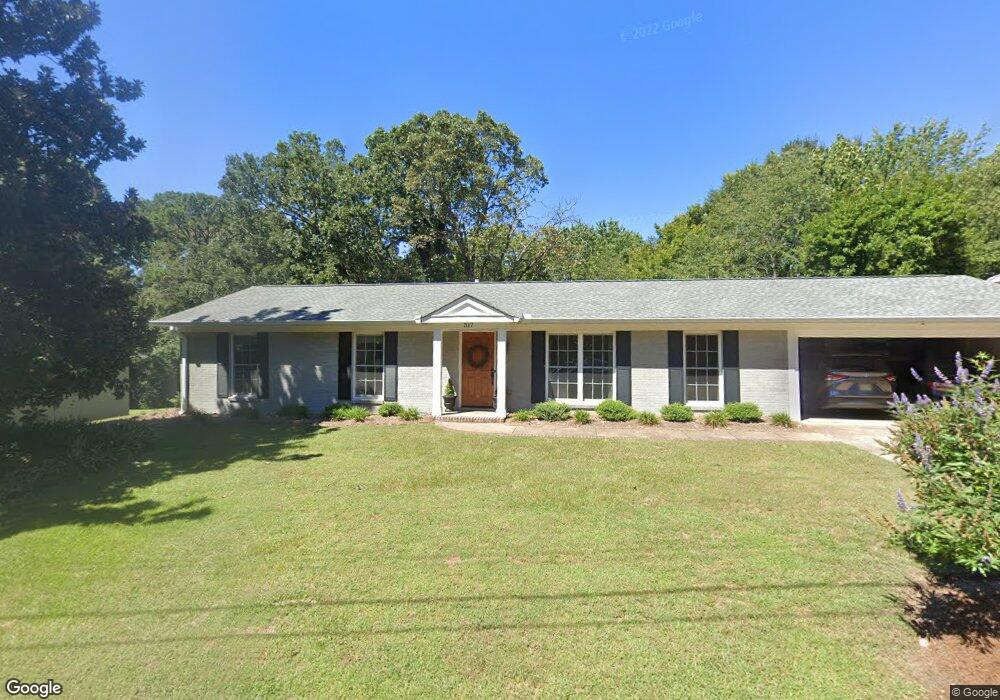
317 Murray St Oxford, MS 38655
Estimated Value: $583,000 - $730,000
3
Beds
2
Baths
1,700
Sq Ft
$380/Sq Ft
Est. Value
About This Home
This home is located at 317 Murray St, Oxford, MS 38655 and is currently estimated at $645,896, approximately $379 per square foot. 317 Murray St is a home located in Lafayette County with nearby schools including Della Davidson Elementary School, Bramlett Elementary School, and Central Elementary School.
Ownership History
Date
Name
Owned For
Owner Type
Purchase Details
Closed on
Apr 25, 2011
Sold by
Red & Blue Investments Llc
Bought by
Simon Jason C and Simon Whitney E
Current Estimated Value
Home Financials for this Owner
Home Financials are based on the most recent Mortgage that was taken out on this home.
Original Mortgage
$100,000
Interest Rate
4.83%
Mortgage Type
New Conventional
Purchase Details
Closed on
Jan 19, 2011
Sold by
Kelly John William
Bought by
Red & Blue Investments
Create a Home Valuation Report for This Property
The Home Valuation Report is an in-depth analysis detailing your home's value as well as a comparison with similar homes in the area
Home Values in the Area
Average Home Value in this Area
Purchase History
| Date | Buyer | Sale Price | Title Company |
|---|---|---|---|
| Simon Jason C | -- | Executive Title | |
| Red & Blue Investments | -- | None Available | |
| Kelly John William | -- | None Available |
Source: Public Records
Mortgage History
| Date | Status | Borrower | Loan Amount |
|---|---|---|---|
| Closed | Simon Jason C | $100,000 |
Source: Public Records
Tax History Compared to Growth
Tax History
| Year | Tax Paid | Tax Assessment Tax Assessment Total Assessment is a certain percentage of the fair market value that is determined by local assessors to be the total taxable value of land and additions on the property. | Land | Improvement |
|---|---|---|---|---|
| 2024 | $3,091 | $25,665 | $0 | $0 |
| 2023 | $3,091 | $25,006 | $0 | $0 |
| 2022 | $2,954 | $25,006 | $0 | $0 |
| 2021 | $749 | $25,006 | $0 | $0 |
| 2020 | $739 | $25,446 | $0 | $0 |
| 2019 | $739 | $25,446 | $0 | $0 |
| 2018 | $375 | $15,016 | $0 | $0 |
| 2017 | $375 | $15,016 | $0 | $0 |
| 2016 | $331 | $14,272 | $0 | $0 |
| 2015 | -- | $14,272 | $0 | $0 |
| 2014 | -- | $14,272 | $0 | $0 |
Source: Public Records
Map
Nearby Homes