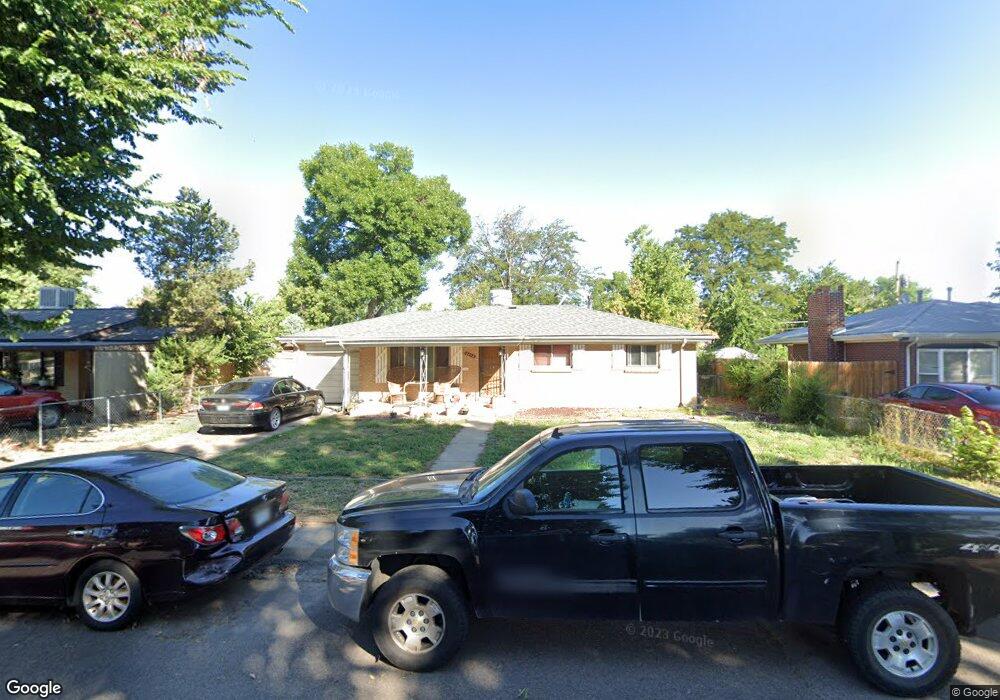
3173 Scranton St Aurora, CO 80011
Morris Heights NeighborhoodEstimated Value: $401,000 - $433,000
3
Beds
2
Baths
1,176
Sq Ft
$352/Sq Ft
Est. Value
About This Home
This home is located at 3173 Scranton St, Aurora, CO 80011 and is currently estimated at $414,292, approximately $352 per square foot. 3173 Scranton St is a home located in Adams County with nearby schools including Park Lane Elementary School, North Middle School Health Sciences & Technology, and Hinkley High School.
Ownership History
Date
Name
Owned For
Owner Type
Purchase Details
Closed on
Nov 11, 2020
Sold by
Tran Al V and Huynh Vu T
Bought by
Huynh Family Trust
Current Estimated Value
Purchase Details
Closed on
Mar 1, 2000
Sold by
Bazille Donald K
Bought by
Tran Ai V and Huynh Vu T
Home Financials for this Owner
Home Financials are based on the most recent Mortgage that was taken out on this home.
Original Mortgage
$97,300
Outstanding Balance
$30,977
Interest Rate
8.31%
Mortgage Type
Stand Alone First
Estimated Equity
$383,315
Purchase Details
Closed on
Nov 20, 1998
Sold by
Kiltie Malcolm K
Bought by
Bazille Donald K
Home Financials for this Owner
Home Financials are based on the most recent Mortgage that was taken out on this home.
Original Mortgage
$100,000
Interest Rate
6.69%
Purchase Details
Closed on
Sep 3, 1998
Sold by
Broach Alfred H and Lee Broach Bertha
Bought by
Kiltie Malcolm K
Purchase Details
Closed on
Sep 30, 1993
Sold by
Kiltie Malcolm K
Bought by
Broach Alfred H and Lee Bertha
Create a Home Valuation Report for This Property
The Home Valuation Report is an in-depth analysis detailing your home's value as well as a comparison with similar homes in the area
Home Values in the Area
Average Home Value in this Area
Purchase History
| Date | Buyer | Sale Price | Title Company |
|---|---|---|---|
| Huynh Family Trust | -- | None Available | |
| Tran Ai V | $139,000 | North American Title Co | |
| Bazille Donald K | $118,000 | -- | |
| Kiltie Malcolm K | -- | -- | |
| Broach Alfred H | -- | -- |
Source: Public Records
Mortgage History
| Date | Status | Borrower | Loan Amount |
|---|---|---|---|
| Open | Tran Ai V | $97,300 | |
| Previous Owner | Bazille Donald K | $100,000 |
Source: Public Records
Tax History
| Year | Tax Paid | Tax Assessment Tax Assessment Total Assessment is a certain percentage of the fair market value that is determined by local assessors to be the total taxable value of land and additions on the property. | Land | Improvement |
|---|---|---|---|---|
| 2025 | $2,696 | $27,470 | $5,780 | $21,690 |
| 2024 | $2,696 | $25,250 | $5,310 | $19,940 |
| 2023 | $2,739 | $29,430 | $5,750 | $23,680 |
| 2022 | $2,458 | $21,630 | $5,490 | $16,140 |
| 2021 | $2,561 | $21,630 | $5,490 | $16,140 |
| 2020 | $2,728 | $23,120 | $5,650 | $17,470 |
| 2019 | $2,723 | $23,120 | $5,650 | $17,470 |
| 2018 | $2,012 | $17,010 | $5,040 | $11,970 |
| 2017 | $1,788 | $17,010 | $5,040 | $11,970 |
| 2016 | $1,379 | $13,010 | $2,590 | $10,420 |
| 2015 | $1,335 | $13,010 | $2,590 | $10,420 |
| 2014 | $1,115 | $10,690 | $2,150 | $8,540 |
Source: Public Records
Map
Nearby Homes
- 3148 Racine St
- 3137 Ursula St
- 3123 Uvalda St
- 3206 Vaughn St
- 3101 Victor St
- 3065 Wheeling St
- 3090 Worchester St
- 3107 Xanadu St
- 1656 N Newark St
- 12056 E 25th Ave
- 2381 Oswego St
- 3008 Zion St
- 2341 Oakland St
- 2507 Zion St
- 2522 Moline St
- 2861 Lima St
- 2859 Lima St
- 11273 E 28th Place
- 11399 E 25th Dr
- 3222 Blackhawk Cir
- 3165 Scranton St
- 3181 Scranton St
- 3166 Salem St
- 3157 Scranton St
- 3160 Salem St
- 3172 Salem St
- 3189 Scranton St
- 3172 Scranton St
- 3156 Scranton St
- 3154 Salem St
- 3178 Salem St
- 3149 Scranton St
- 3180 Scranton St
- 3148 Scranton St
- 3148 Salem St
- 3201 Scranton St
- 3140 Scranton St
- 3141 Scranton St
- 3171 Troy St
- 3181 Salem St
Your Personal Tour Guide
Ask me questions while you tour the home.