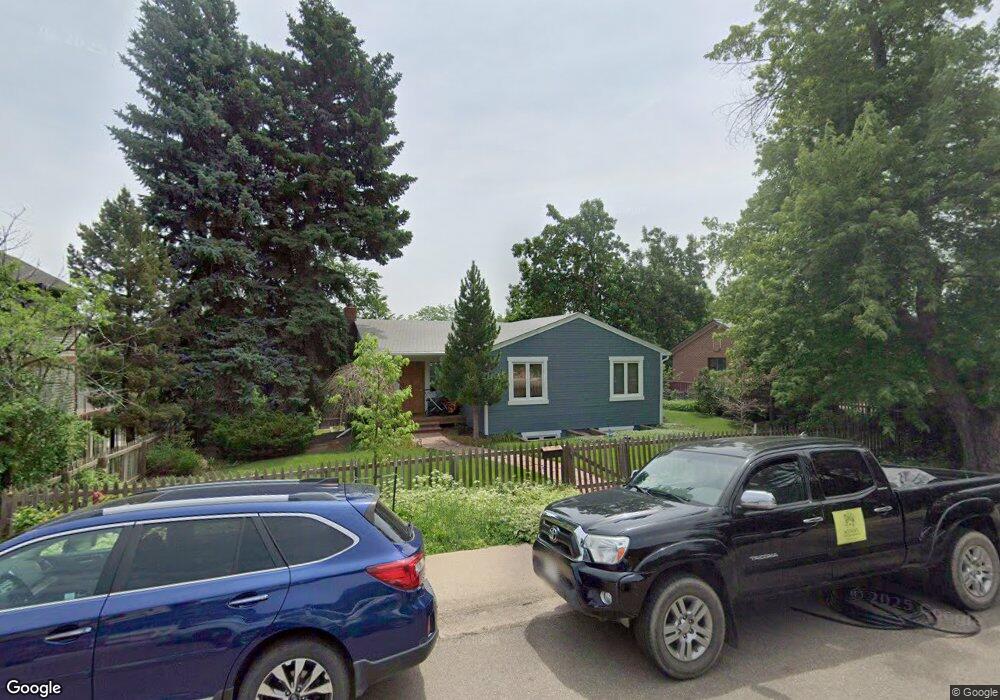
3176 4th St Boulder, CO 80304
Newlands NeighborhoodEstimated Value: $1,517,110 - $2,214,000
3
Beds
2
Baths
2,026
Sq Ft
$910/Sq Ft
Est. Value
About This Home
This home is located at 3176 4th St, Boulder, CO 80304 and is currently estimated at $1,844,528, approximately $910 per square foot. 3176 4th St is a home located in Boulder County with nearby schools including Foothill Elementary School, Casey Middle School, and Boulder High School.
Ownership History
Date
Name
Owned For
Owner Type
Purchase Details
Closed on
Mar 9, 2016
Sold by
Fox Richard J and Dumbaugh Cathleen M
Bought by
Fox Richard J
Current Estimated Value
Home Financials for this Owner
Home Financials are based on the most recent Mortgage that was taken out on this home.
Original Mortgage
$417,000
Outstanding Balance
$169,950
Interest Rate
3.65%
Mortgage Type
New Conventional
Estimated Equity
$1,674,578
Purchase Details
Closed on
Jul 31, 2002
Sold by
Buck Catherine R
Bought by
Fox Richard J
Home Financials for this Owner
Home Financials are based on the most recent Mortgage that was taken out on this home.
Original Mortgage
$520,000
Interest Rate
5.37%
Mortgage Type
Purchase Money Mortgage
Purchase Details
Closed on
May 13, 1999
Sold by
Barr Welles Charles H and Barr Jennifer L
Bought by
Buck Catherine R
Home Financials for this Owner
Home Financials are based on the most recent Mortgage that was taken out on this home.
Original Mortgage
$267,000
Interest Rate
7.04%
Purchase Details
Closed on
Jun 6, 1995
Sold by
Osborne Carol Ann and Chilson Andrew Harper
Bought by
Welles Charles H
Purchase Details
Closed on
Nov 6, 1979
Bought by
Fox Richard J and Fox Cathleen D
Purchase Details
Closed on
May 31, 1974
Bought by
Fox Richard J and Fox Cathleen D
Create a Home Valuation Report for This Property
The Home Valuation Report is an in-depth analysis detailing your home's value as well as a comparison with similar homes in the area
Home Values in the Area
Average Home Value in this Area
Purchase History
| Date | Buyer | Sale Price | Title Company |
|---|---|---|---|
| Fox Richard J | -- | None Available | |
| Fox Richard J | $650,000 | First American Heritage Titl | |
| Buck Catherine R | $445,000 | -- | |
| Welles Charles H | $249,500 | -- | |
| Fox Richard J | -- | -- | |
| Fox Richard J | $44,500 | -- |
Source: Public Records
Mortgage History
| Date | Status | Borrower | Loan Amount |
|---|---|---|---|
| Open | Fox Richard J | $417,000 | |
| Closed | Fox Richard J | $520,000 | |
| Previous Owner | Buck Catherine R | $267,000 | |
| Closed | Buck Catherine R | $89,000 |
Source: Public Records
Tax History
| Year | Tax Paid | Tax Assessment Tax Assessment Total Assessment is a certain percentage of the fair market value that is determined by local assessors to be the total taxable value of land and additions on the property. | Land | Improvement |
|---|---|---|---|---|
| 2025 | $10,415 | $107,381 | $96,643 | $10,738 |
| 2024 | $10,415 | $107,381 | $96,643 | $10,738 |
| 2023 | $10,232 | $117,612 | $109,167 | $12,130 |
| 2022 | $8,522 | $90,961 | $81,865 | $9,096 |
| 2021 | $8,130 | $93,579 | $84,221 | $9,358 |
| 2020 | $7,243 | $83,205 | $66,567 | $16,638 |
| 2019 | $7,132 | $83,205 | $66,567 | $16,638 |
| 2018 | $6,242 | $72,000 | $57,600 | $14,400 |
| 2017 | $6,047 | $79,600 | $63,680 | $15,920 |
| 2016 | $5,547 | $64,078 | $50,785 | $13,293 |
| 2015 | $5,253 | $57,534 | $24,994 | $32,540 |
| 2014 | $4,838 | $57,534 | $24,994 | $32,540 |
Source: Public Records
Map
Nearby Homes
Your Personal Tour Guide
Ask me questions while you tour the home.