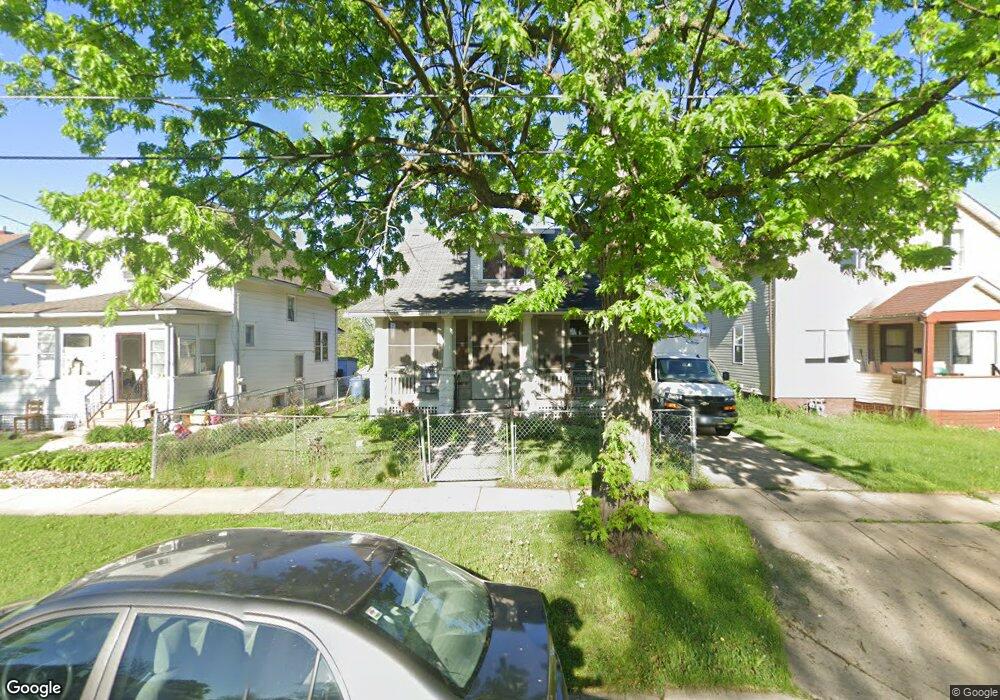
318 Stuart Ave Aurora, IL 60505
Light of the Community NeighborhoodEstimated Value: $198,000 - $252,000
3
Beds
1
Bath
1,326
Sq Ft
$168/Sq Ft
Est. Value
About This Home
This home is located at 318 Stuart Ave, Aurora, IL 60505 and is currently estimated at $222,216, approximately $167 per square foot. 318 Stuart Ave is a home located in Kane County with nearby schools including Oak Park Elementary School, Henry W Cowherd Middle School, and East Aurora High School.
Ownership History
Date
Name
Owned For
Owner Type
Purchase Details
Closed on
Mar 28, 2002
Sold by
Flores Elver A
Bought by
Castillo Jorge Alejandro
Current Estimated Value
Home Financials for this Owner
Home Financials are based on the most recent Mortgage that was taken out on this home.
Original Mortgage
$104,037
Outstanding Balance
$43,313
Interest Rate
6.87%
Mortgage Type
FHA
Estimated Equity
$178,903
Purchase Details
Closed on
Oct 2, 2000
Sold by
Flores Elver A and Jovel Milton A
Bought by
Flores Elver A and Morales Gloria
Home Financials for this Owner
Home Financials are based on the most recent Mortgage that was taken out on this home.
Original Mortgage
$22,000
Interest Rate
13.59%
Mortgage Type
Stand Alone Second
Purchase Details
Closed on
Mar 5, 1999
Sold by
Zamora Aurelio
Bought by
Flores Elver A and Jovel Milton A
Home Financials for this Owner
Home Financials are based on the most recent Mortgage that was taken out on this home.
Original Mortgage
$71,575
Interest Rate
6.78%
Mortgage Type
FHA
Create a Home Valuation Report for This Property
The Home Valuation Report is an in-depth analysis detailing your home's value as well as a comparison with similar homes in the area
Home Values in the Area
Average Home Value in this Area
Purchase History
| Date | Buyer | Sale Price | Title Company |
|---|---|---|---|
| Castillo Jorge Alejandro | $105,000 | First American Title Co | |
| Flores Elver A | -- | -- | |
| Flores Elver A | $72,000 | -- |
Source: Public Records
Mortgage History
| Date | Status | Borrower | Loan Amount |
|---|---|---|---|
| Open | Castillo Jorge Alejandro | $104,037 | |
| Previous Owner | Flores Elver A | $22,000 | |
| Previous Owner | Flores Elver A | $71,575 |
Source: Public Records
Tax History
| Year | Tax Paid | Tax Assessment Tax Assessment Total Assessment is a certain percentage of the fair market value that is determined by local assessors to be the total taxable value of land and additions on the property. | Land | Improvement |
|---|---|---|---|---|
| 2024 | $4,218 | $61,527 | $4,292 | $57,235 |
| 2023 | $4,056 | $54,278 | $3,835 | $50,443 |
| 2022 | $3,741 | $49,241 | $3,499 | $45,742 |
| 2021 | $3,701 | $45,844 | $3,258 | $42,586 |
| 2020 | $3,541 | $42,582 | $3,026 | $39,556 |
| 2019 | $3,901 | $44,269 | $2,804 | $41,465 |
| 2018 | $3,605 | $39,595 | $2,594 | $37,001 |
| 2017 | $3,355 | $34,208 | $2,390 | $31,818 |
| 2016 | $3,136 | $29,802 | $2,049 | $27,753 |
| 2015 | -- | $25,874 | $1,762 | $24,112 |
| 2014 | -- | $24,809 | $1,619 | $23,190 |
| 2013 | -- | $27,045 | $1,547 | $25,498 |
Source: Public Records
Map
Nearby Homes
Your Personal Tour Guide
Ask me questions while you tour the home.