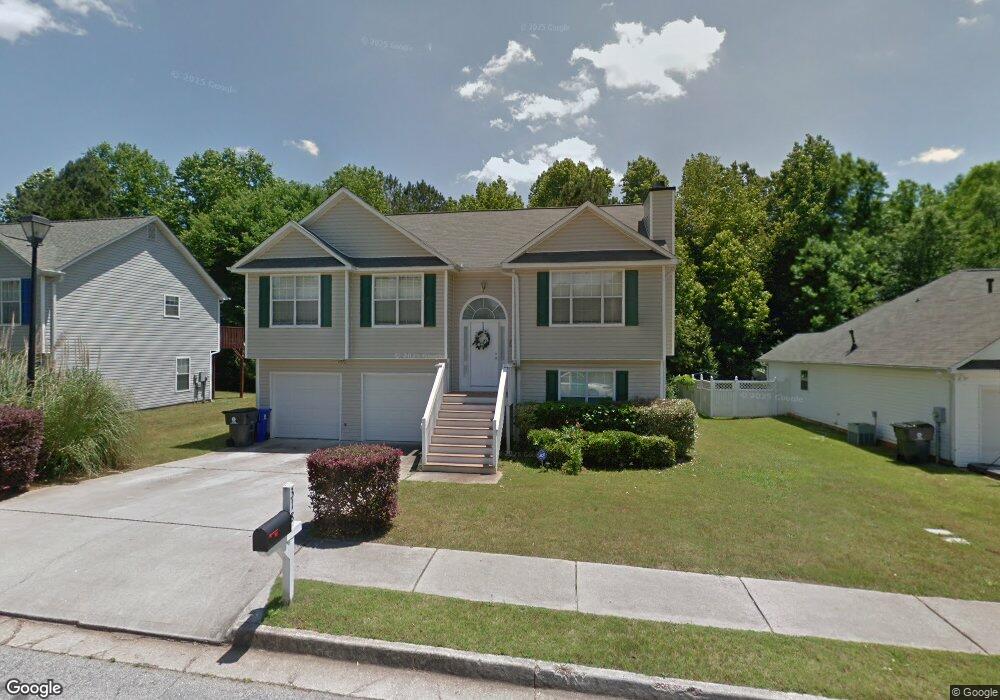
318 Summer Hill Cir Stockbridge, GA 30281
Estimated Value: $301,000 - $313,000
4
Beds
3
Baths
2,038
Sq Ft
$151/Sq Ft
Est. Value
About This Home
This home is located at 318 Summer Hill Cir, Stockbridge, GA 30281 and is currently estimated at $307,271, approximately $150 per square foot. 318 Summer Hill Cir is a home located in Henry County with nearby schools including Stockbridge Elementary School, Smith-Barnes Elementary School, and Eagle's Landing Middle School.
Ownership History
Date
Name
Owned For
Owner Type
Purchase Details
Closed on
May 13, 2022
Sold by
Mile High Borrower 1 Income Llc
Bought by
Mile High Tl Borrower 1 Income Llc
Current Estimated Value
Purchase Details
Closed on
Jun 16, 2021
Sold by
Sidberry Sheila A
Bought by
Mile High Borrower 1 Income Llc
Purchase Details
Closed on
Sep 19, 2001
Sold by
Fernandez Jose L
Bought by
Sidberry Sheila A
Home Financials for this Owner
Home Financials are based on the most recent Mortgage that was taken out on this home.
Original Mortgage
$128,155
Interest Rate
6.89%
Mortgage Type
New Conventional
Purchase Details
Closed on
Nov 12, 1999
Sold by
Tim Jones Communities Inc
Bought by
Fernandez Jose L
Home Financials for this Owner
Home Financials are based on the most recent Mortgage that was taken out on this home.
Original Mortgage
$125,050
Interest Rate
7.7%
Mortgage Type
FHA
Create a Home Valuation Report for This Property
The Home Valuation Report is an in-depth analysis detailing your home's value as well as a comparison with similar homes in the area
Home Values in the Area
Average Home Value in this Area
Purchase History
| Date | Buyer | Sale Price | Title Company |
|---|---|---|---|
| Mile High Tl Borrower 1 Income Llc | -- | -- | |
| Mile High Borrower 1 Income Llc | $255,000 | -- | |
| Sidberry Sheila A | $134,900 | -- | |
| Fernandez Jose L | $125,200 | -- | |
| Tim Jones Communities Inc | $22,500 | -- |
Source: Public Records
Mortgage History
| Date | Status | Borrower | Loan Amount |
|---|---|---|---|
| Previous Owner | Sidberry Sheila A | $128,155 | |
| Previous Owner | Tim Jones Communities Inc | $125,050 |
Source: Public Records
Tax History Compared to Growth
Tax History
| Year | Tax Paid | Tax Assessment Tax Assessment Total Assessment is a certain percentage of the fair market value that is determined by local assessors to be the total taxable value of land and additions on the property. | Land | Improvement |
|---|---|---|---|---|
| 2025 | $5,122 | $124,360 | $12,000 | $112,360 |
| 2024 | $5,122 | $121,160 | $12,000 | $109,160 |
| 2023 | $4,972 | $117,680 | $10,000 | $107,680 |
| 2022 | $3,851 | $94,760 | $10,000 | $84,760 |
| 2021 | $2,810 | $67,440 | $10,000 | $57,440 |
| 2020 | $2,742 | $65,640 | $8,000 | $57,640 |
| 2019 | $2,532 | $61,760 | $8,000 | $53,760 |
| 2018 | $2,333 | $56,560 | $8,000 | $48,560 |
| 2016 | $2,138 | $51,480 | $8,000 | $43,480 |
| 2015 | $1,916 | $44,320 | $6,000 | $38,320 |
| 2014 | $1,620 | $36,400 | $4,800 | $31,600 |
Source: Public Records
Map
Nearby Homes
- 816 Lorraine Ln Unit 4
- 503 Goldfinch Way
- 537 Goldfinch Way
- 172 Garden Walk
- 100 Garden Walk
- 564 Goldfinch Way
- 9 Cheyenne Dr
- 396 Avian Forest Dr
- 0 Rock Quarry Rd Unit 10142677
- 137 Dustin Dr
- 113 Garden Walk
- 144 Garden Walk
- 377 Avian Forest Dr
- 128 Garden Walk
- 105 Windsong Dr
- 195 Northpark Trail
- 103 Ashwood Ct N
- 213 Baron Ct
- 318 Eagle Ct
- 107 Willow Oak Ct
- 322 Summer Hill Cir Unit 5
- 314 Summer Hill Cir
- 326 Summer Hill Cir Unit 5
- 310 Summer Hill Cir Unit 28
- 310 Summer Hill Cir Unit 3
- 301 Summer Hill Cir
- 301 Summer Hill Cir Unit 3
- 321 Summer Hill Cir
- 330 Summer Hill Cir Unit 5
- 325 Summer Hill Cir Unit 5
- 306 Summer Hill Cir Unit 3
- 285 Summer Hill Cir Unit 3
- 334 Summer Hill Cir
- 302 Summer Hill Cir Unit 3
- 612 Rust Way
- 333 Summer Hill Cir
- 294 Summer Hill Cir Unit 3
- 279 Summer Hill Cir Unit 3
- 298 Summer Hill Cir
- 290 Summer Hill Cir Unit 3