Estimated Value: $152,497 - $181,000
--
Bed
--
Bath
1,404
Sq Ft
$118/Sq Ft
Est. Value
About This Home
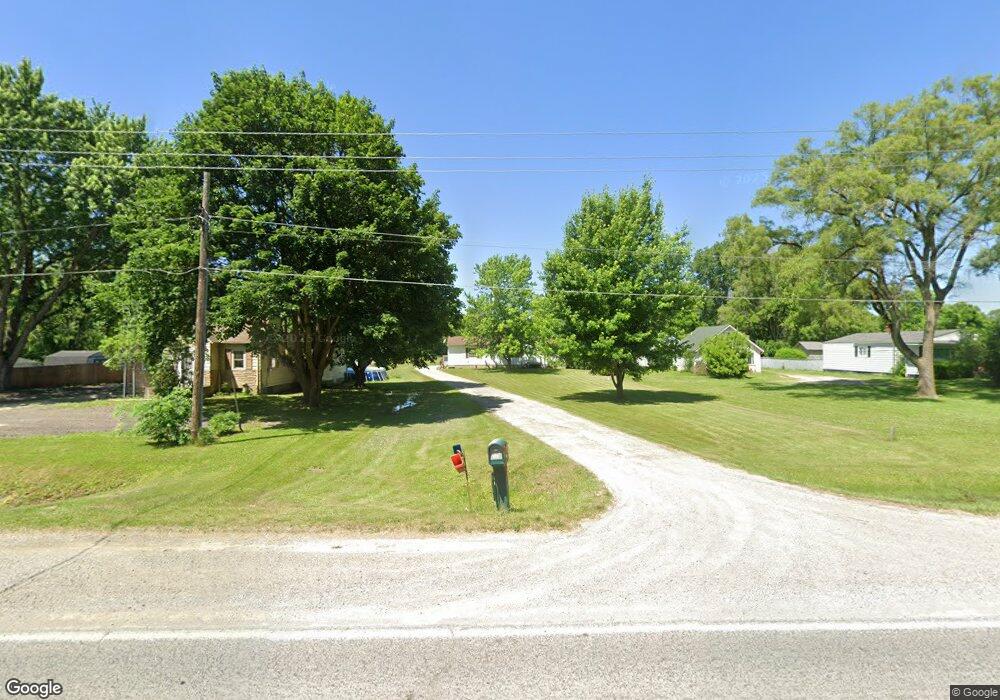
This home is located at 3185 N Belsay Rd, Flint, MI 48506 and is currently estimated at $165,874, approximately $118 per square foot. 3185 N Belsay Rd is a home located in Genesee County with nearby schools including Weston Elementary School, Kate Dowdall Elementary School, and Leota Fiedler Elementary School.
Ownership History
Date
Name
Owned For
Owner Type
Purchase Details
Closed on
Mar 18, 2015
Sold by
Howard George W
Bought by
The Huntington National Bank
Current Estimated Value
Purchase Details
Closed on
Jul 21, 2009
Sold by
Howard George W
Bought by
Howard George W and Howard Shane William
Purchase Details
Closed on
Jul 26, 2005
Sold by
Justice Jeffery H and Justice Kristie L
Bought by
Howard George W
Home Financials for this Owner
Home Financials are based on the most recent Mortgage that was taken out on this home.
Original Mortgage
$130,469
Interest Rate
5.69%
Mortgage Type
FHA
Purchase Details
Closed on
May 3, 2002
Sold by
Karpelenia David
Bought by
Justice Jeffery H and Justice Kristie L
Purchase Details
Closed on
Dec 16, 1996
Sold by
Anderson Kirby and Anderson Jennifer
Bought by
Karpelenia David
Create a Home Valuation Report for This Property
The Home Valuation Report is an in-depth analysis detailing your home's value as well as a comparison with similar homes in the area
Home Values in the Area
Average Home Value in this Area
Purchase History
| Date | Buyer | Sale Price | Title Company |
|---|---|---|---|
| The Huntington National Bank | $47,400 | None Available | |
| Howard George W | -- | Precision Title & Escrow Age | |
| Howard George W | $131,500 | Lawyers Title | |
| Justice Jeffery H | $118,900 | Metropolitan Title Company | |
| Karpelenia David | -- | Metropolitan Title Company | |
| Karpelenia David | -- | Metropolitan Title Company |
Source: Public Records
Mortgage History
| Date | Status | Borrower | Loan Amount |
|---|---|---|---|
| Previous Owner | Howard George W | $130,469 |
Source: Public Records
Tax History Compared to Growth
Tax History
| Year | Tax Paid | Tax Assessment Tax Assessment Total Assessment is a certain percentage of the fair market value that is determined by local assessors to be the total taxable value of land and additions on the property. | Land | Improvement |
|---|---|---|---|---|
| 2025 | $1,960 | $77,500 | $0 | $0 |
| 2024 | $541 | $76,700 | $0 | $0 |
| 2023 | $516 | $70,400 | $0 | $0 |
| 2022 | $1,601 | $73,100 | $0 | $0 |
| 2021 | $1,587 | $66,400 | $0 | $0 |
| 2020 | $472 | $60,400 | $0 | $0 |
| 2019 | $465 | $54,200 | $0 | $0 |
| 2018 | $1,520 | $46,800 | $0 | $0 |
| 2017 | $1,440 | $45,700 | $0 | $0 |
| 2016 | $1,428 | $43,500 | $0 | $0 |
| 2015 | $1,284 | $41,000 | $0 | $0 |
| 2014 | $429 | $38,100 | $0 | $0 |
| 2012 | -- | $35,800 | $35,800 | $0 |
Source: Public Records
Map
Nearby Homes
- 3201 Gehring Dr
- 5467 Richfield Rd
- 3365 Eastdale Dr
- 3389 Eastdale Dr
- 3247 Mills Acres St
- 3280 Lynne Ave
- 3251 Lynne Ave
- 3454 Eastdale Dr
- 4062 N Belsay Rd
- 6077 Crown Point
- 6158 Golfview Dr
- 6443 Richfield Rd
- V/L S Sycamore Dr
- 3414 N Genesee Rd
- 2411 Briar Creek Ln
- 2211 N Sycamore Dr
- 0 Whisper Ridge Ct
- 1 Whisper Ridge Ct
- 5142 Berneda Dr
- 3294 Comer Dr
- 3187 N Belsay Rd
- 3167 N Belsay Rd
- 3189 N Belsay Rd
- 3159 N Belsay Rd
- 3191 N Belsay Rd
- 3153 N Belsay Rd
- 3203 N Belsay Rd
- 3147 N Belsay Rd
- 3211 N Belsay Rd
- 3139 N Belsay Rd
- 3178 Gehring Dr
- 3170 Gehring Dr
- 3188 Gehring Dr
- 3158 Gehring Dr
- 3160 N Belsay Rd
- 5486 Richfield Rd
- 3148 Gehring Dr
- 3223 N Belsay Rd
- 3117 N Belsay Rd
- 3138 Gehring Dr