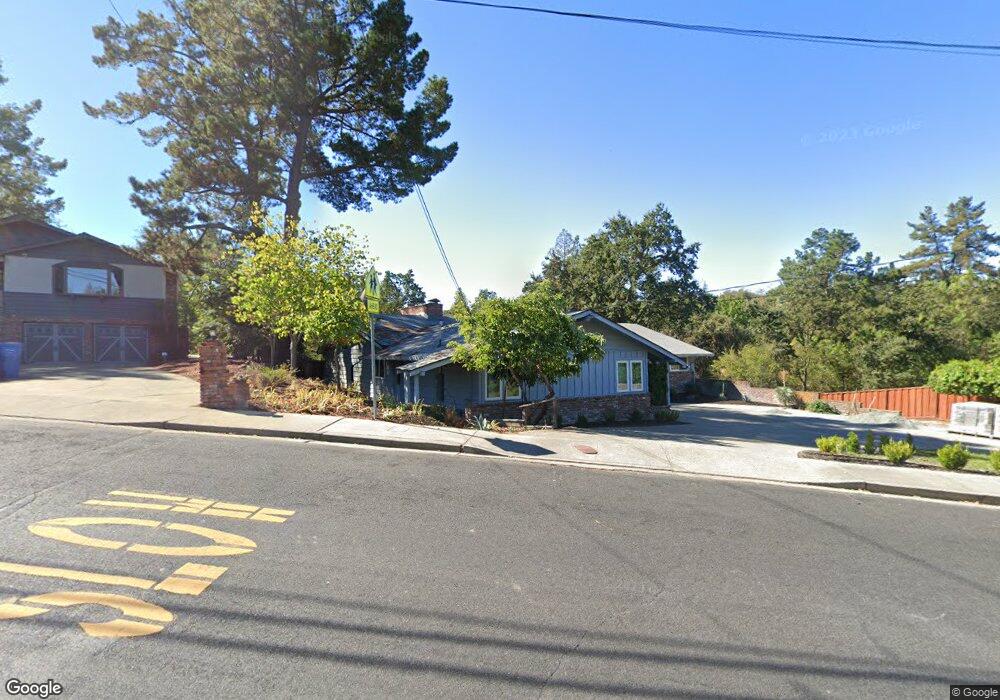
3185 Walnut Blvd Walnut Creek, CA 94596
Walnut Heights NeighborhoodEstimated Value: $1,931,000 - $2,423,190
5
Beds
3
Baths
3,005
Sq Ft
$706/Sq Ft
Est. Value
About This Home
This home is located at 3185 Walnut Blvd, Walnut Creek, CA 94596 and is currently estimated at $2,122,798, approximately $706 per square foot. 3185 Walnut Blvd is a home located in Contra Costa County with nearby schools including Walnut Heights Elementary School, Walnut Creek Intermediate School, and Las Lomas High School.
Ownership History
Date
Name
Owned For
Owner Type
Purchase Details
Closed on
Apr 7, 2023
Sold by
Bauer Jason and Bauer Laura
Bought by
Bauer Family Trust
Current Estimated Value
Purchase Details
Closed on
Aug 16, 2018
Sold by
Ha Investments Llc
Bought by
Bauer Jason and Bauer Laura
Home Financials for this Owner
Home Financials are based on the most recent Mortgage that was taken out on this home.
Original Mortgage
$1,170,000
Interest Rate
4.5%
Mortgage Type
New Conventional
Purchase Details
Closed on
May 9, 2018
Sold by
Taines Sarah and Taines Peter
Bought by
Ha Investments Llc
Purchase Details
Closed on
Apr 28, 2006
Sold by
Taines Robert and Taines Beatrice
Bought by
Taines Robert and Taines Beatrice
Home Financials for this Owner
Home Financials are based on the most recent Mortgage that was taken out on this home.
Original Mortgage
$250,000
Interest Rate
6.19%
Mortgage Type
Credit Line Revolving
Create a Home Valuation Report for This Property
The Home Valuation Report is an in-depth analysis detailing your home's value as well as a comparison with similar homes in the area
Home Values in the Area
Average Home Value in this Area
Purchase History
| Date | Buyer | Sale Price | Title Company |
|---|---|---|---|
| Bauer Family Trust | -- | None Listed On Document | |
| Bauer Jason | $1,300,000 | Fidelity National Title Comp | |
| Ha Investments Llc | $1,120,000 | Fidelity National Title Comp | |
| Taines Robert | -- | None Available |
Source: Public Records
Mortgage History
| Date | Status | Borrower | Loan Amount |
|---|---|---|---|
| Previous Owner | Bauer Jason | $137,000 | |
| Previous Owner | Bauer Jason | $1,157,000 | |
| Previous Owner | Bauer Jason | $1,170,000 | |
| Previous Owner | Taines Robert | $250,000 | |
| Previous Owner | Taines Robert | $100,000 |
Source: Public Records
Tax History Compared to Growth
Tax History
| Year | Tax Paid | Tax Assessment Tax Assessment Total Assessment is a certain percentage of the fair market value that is determined by local assessors to be the total taxable value of land and additions on the property. | Land | Improvement |
|---|---|---|---|---|
| 2025 | $17,451 | $1,504,851 | $1,003,965 | $500,886 |
| 2024 | $16,961 | $1,475,345 | $984,280 | $491,065 |
| 2023 | $16,961 | $1,446,418 | $964,981 | $481,437 |
| 2022 | $16,582 | $1,418,058 | $946,060 | $471,998 |
| 2021 | $16,133 | $1,390,254 | $927,510 | $462,744 |
| 2019 | $15,298 | $1,300,000 | $900,000 | $400,000 |
| 2018 | $2,861 | $168,021 | $30,145 | $137,876 |
| 2017 | $2,417 | $164,727 | $29,554 | $135,173 |
| 2016 | $2,349 | $161,498 | $28,975 | $132,523 |
| 2015 | $2,279 | $159,073 | $28,540 | $130,533 |
| 2014 | $2,231 | $155,958 | $27,981 | $127,977 |
Source: Public Records
Map
Nearby Homes
- 25 Fraser Dr
- 1101 Scots Ln
- 1080 Scots Ln
- 25 Adeline Dr
- 16 Simpson Dr
- 3081 Walnut Blvd
- 211 Vallecito Ln
- 82 El Camino Corto
- 457 Summit Rd
- 49 Terra Bella Dr
- 2245 Blackwood Dr
- 2101 Hillview Dr
- 61 Alberta Terrace
- 161 Bales Dr
- 2345 San Miguel Dr
- 233 Sierra Dr
- 421 Twin Oaks Ln
- 755 Palmer Rd
- 5 Kayser Ct
- 28 Holcomb Ct