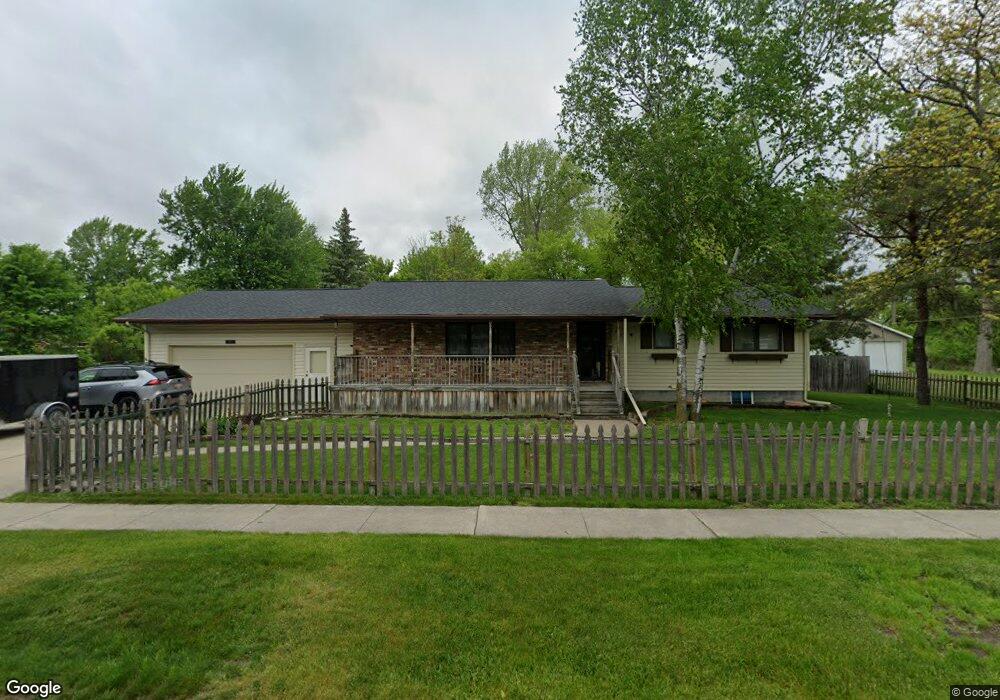
319 E Gary St Bay City, MI 48706
Estimated Value: $167,000 - $199,651
3
Beds
2
Baths
1,248
Sq Ft
$146/Sq Ft
Est. Value
About This Home
This home is located at 319 E Gary St, Bay City, MI 48706 and is currently estimated at $182,663, approximately $146 per square foot. 319 E Gary St is a home located in Bay County with nearby schools including Linsday Elementary School, Handy Middle School, and Bay City Central High School.
Ownership History
Date
Name
Owned For
Owner Type
Purchase Details
Closed on
Sep 18, 2012
Sold by
Middlebrooks Chuen Lan Chang and Chang Chuen Lan
Bought by
Middlebrooks Chuen Lan Chang and Middlebrooks Eric R
Current Estimated Value
Home Financials for this Owner
Home Financials are based on the most recent Mortgage that was taken out on this home.
Original Mortgage
$83,000
Outstanding Balance
$13,806
Interest Rate
3.59%
Mortgage Type
New Conventional
Estimated Equity
$168,857
Purchase Details
Closed on
May 26, 2005
Sold by
Woodman Thomas R and Woodman Christine M
Bought by
Chang Chuen Lan
Home Financials for this Owner
Home Financials are based on the most recent Mortgage that was taken out on this home.
Original Mortgage
$110,000
Interest Rate
6.07%
Mortgage Type
Fannie Mae Freddie Mac
Purchase Details
Closed on
Nov 1, 1988
Sold by
Neering Gerald F and Gloria Lewis
Bought by
Woodman Thomas R and Woodman Christine M
Create a Home Valuation Report for This Property
The Home Valuation Report is an in-depth analysis detailing your home's value as well as a comparison with similar homes in the area
Home Values in the Area
Average Home Value in this Area
Purchase History
| Date | Buyer | Sale Price | Title Company |
|---|---|---|---|
| Middlebrooks Chuen Lan Chang | -- | Superior Title & Settlement | |
| Chang Chuen Lan | $137,500 | Fatic | |
| Woodman Thomas R | $65,900 | -- |
Source: Public Records
Mortgage History
| Date | Status | Borrower | Loan Amount |
|---|---|---|---|
| Open | Middlebrooks Chuen Lan Chang | $83,000 | |
| Closed | Chang Chuen Lan | $110,000 |
Source: Public Records
Tax History Compared to Growth
Tax History
| Year | Tax Paid | Tax Assessment Tax Assessment Total Assessment is a certain percentage of the fair market value that is determined by local assessors to be the total taxable value of land and additions on the property. | Land | Improvement |
|---|---|---|---|---|
| 2025 | $2,609 | $92,350 | $0 | $0 |
| 2024 | $2,147 | $81,350 | $0 | $0 |
| 2023 | $2,044 | $68,850 | $0 | $0 |
| 2022 | $2,348 | $62,600 | $0 | $0 |
| 2021 | $2,208 | $58,400 | $58,400 | $0 |
| 2020 | $2,348 | $56,950 | $56,950 | $0 |
| 2019 | $2,297 | $55,150 | $0 | $0 |
| 2018 | $2,273 | $53,350 | $0 | $0 |
| 2017 | $2,224 | $53,100 | $0 | $0 |
| 2016 | $2,213 | $53,450 | $0 | $53,450 |
| 2015 | $2,150 | $53,450 | $0 | $53,450 |
| 2014 | $2,150 | $51,600 | $0 | $51,600 |
Source: Public Records
Map
Nearby Homes
- 307 Mosher St
- 1106 State St
- 1707 N Henry St
- 1012 Litchfield St
- 117 E Smith St
- 1005 N Wenona Ave
- 900 E Fulton St
- 203 Elm St
- 204 Elm St
- 902 Litchfield St
- 403 State St
- 23 Old Kawkawlin Rd
- 305 Marston St
- 706 N Linn St
- 25 State Park Dr
- 609 N Henry St
- 208 State St
- 604 N Catherine St
- 1000 E Florence St
- 607 N Dewitt St