Estimated Value: $628,000 - $666,000
4
Beds
3
Baths
2,064
Sq Ft
$315/Sq Ft
Est. Value
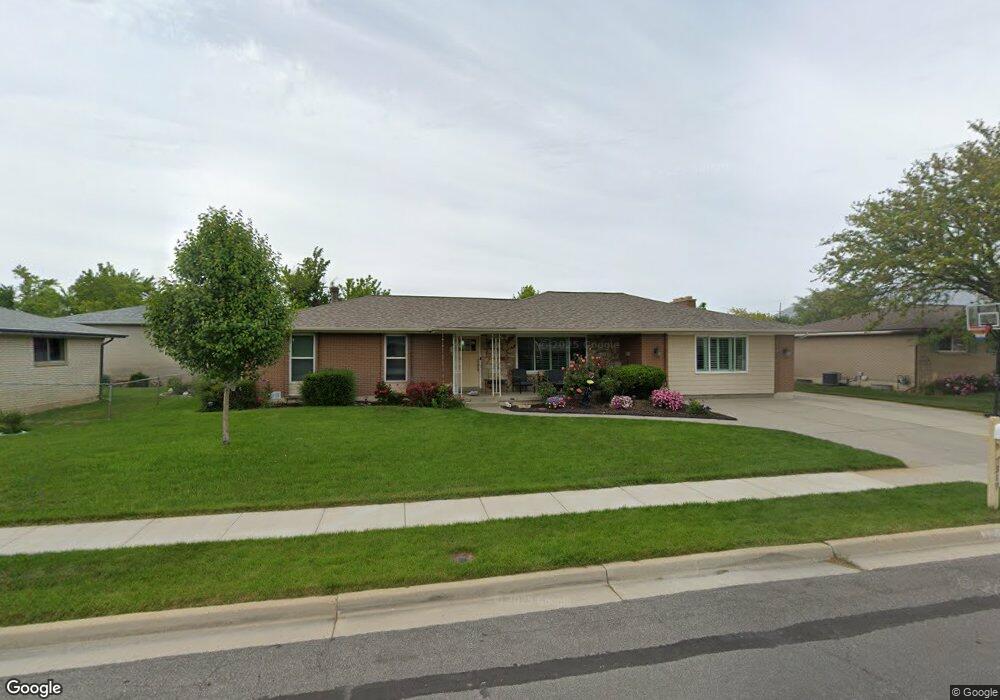
About This Home
This home is located at 319 Susan Cir, Sandy, UT 84070 and is currently estimated at $650,031, approximately $314 per square foot. 319 Susan Cir is a home located in Salt Lake County with nearby schools including Glacier Hills Elementary, Mount Jordan Middle School, and Jordan High.
Ownership History
Date
Name
Owned For
Owner Type
Purchase Details
Closed on
Aug 25, 2011
Sold by
Mower Brett A and Mower Julie C
Bought by
Mower Julie C and Mower Brett A
Current Estimated Value
Home Financials for this Owner
Home Financials are based on the most recent Mortgage that was taken out on this home.
Original Mortgage
$153,500
Outstanding Balance
$60,195
Interest Rate
4.43%
Mortgage Type
New Conventional
Estimated Equity
$589,836
Purchase Details
Closed on
Aug 12, 1999
Sold by
Black David A and Black Alice N
Bought by
Mower Brett A and Mower Julie C
Home Financials for this Owner
Home Financials are based on the most recent Mortgage that was taken out on this home.
Original Mortgage
$125,000
Interest Rate
7.7%
Mortgage Type
Balloon
Create a Home Valuation Report for This Property
The Home Valuation Report is an in-depth analysis detailing your home's value as well as a comparison with similar homes in the area
Home Values in the Area
Average Home Value in this Area
Purchase History
We collect this data history from publicly available records. To have your information removed, we recommend requesting removal directly through your county’s website.
| Date | Buyer | Sale Price | Title Company |
|---|---|---|---|
| Mower Julie C | -- | Integrated Title Ins Svcs | |
| Mower Brett A | -- | Meridian Title |
Source: Public Records
Mortgage History
We collect this data history from publicly available records. To have your information removed, we recommend requesting removal directly through your county’s website.
| Date | Status | Borrower | Loan Amount |
|---|---|---|---|
| Open | Mower Julie C | $153,500 | |
| Closed | Mower Brett A | $125,000 |
Source: Public Records
Tax History
| Year | Tax Paid | Tax Assessment Tax Assessment Total Assessment is a certain percentage of the fair market value that is determined by local assessors to be the total taxable value of land and additions on the property. | Land | Improvement |
|---|---|---|---|---|
| 2025 | $3,365 | $640,100 | $196,300 | $443,800 |
| 2024 | $3,365 | $622,300 | $190,900 | $431,400 |
| 2023 | $2,758 | $508,600 | $183,400 | $325,200 |
| 2022 | $2,910 | $524,200 | $118,200 | $406,000 |
| 2021 | $2,620 | $401,700 | $90,700 | $311,000 |
| 2020 | $2,507 | $362,500 | $90,700 | $271,800 |
| 2019 | $2,378 | $335,100 | $85,600 | $249,500 |
| 2018 | $2,143 | $314,400 | $85,600 | $228,800 |
| 2017 | $2,106 | $295,200 | $85,600 | $209,600 |
| 2016 | $2,160 | $292,600 | $85,600 | $207,000 |
| 2015 | $2,046 | $256,500 | $83,000 | $173,500 |
| 2014 | $1,992 | $244,800 | $80,500 | $164,300 |
Source: Public Records
Map
Nearby Homes
- 370 E 9400 S
- 9571 S David St
- 9662 S 520 E
- 9203 S 220 E
- 504 E 9765 S
- 9822 S Darin Dr
- 362 E 9150 S
- 448 E 9150 S
- 9239 S Brighton View Dr
- 9884 S Cascade Park Dr
- 322 Lane Cir
- 783 E Newfield Dr
- 41 W Crawford Place
- 8947 S 500 E
- 9294 S Rose Cottage Way Unit 207
- 541 Mingo View Ave
- 65 W Alta View Way
- 8750 S 500 E
- 8807 S Cy's Park Ln E Unit 9
- 10973 S Brand Ln E Unit 12
Your Personal Tour Guide
Ask me questions while you tour the home.