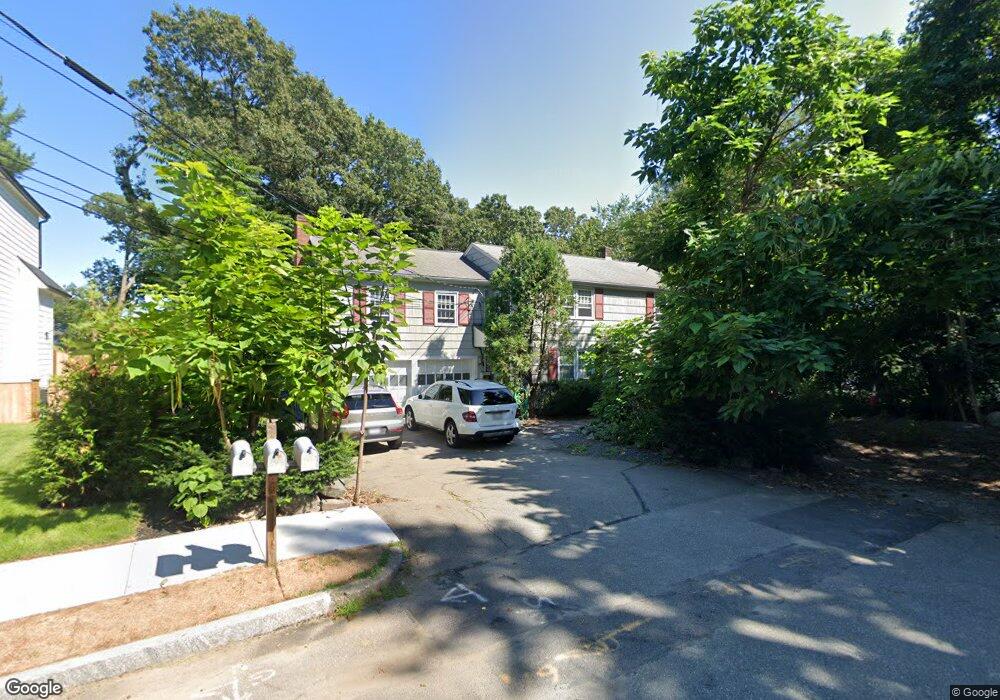
32 Coyne Rd Unit 34 Waban, MA 02468
Waban NeighborhoodEstimated Value: $1,430,000 - $1,819,240
5
Beds
2
Baths
2,888
Sq Ft
$562/Sq Ft
Est. Value
About This Home
This home is located at 32 Coyne Rd Unit 34, Waban, MA 02468 and is currently estimated at $1,624,310, approximately $562 per square foot. 32 Coyne Rd Unit 34 is a home located in Middlesex County with nearby schools including Zervas Elementary School, Oak Hill Middle School, and Newton South High School.
Ownership History
Date
Name
Owned For
Owner Type
Purchase Details
Closed on
Nov 30, 2018
Sold by
32 & 34 Coyne Road Rt
Bought by
Michael V Lepie T 2014
Current Estimated Value
Purchase Details
Closed on
Nov 22, 2002
Sold by
Chung Lois W and Chung Tommy Y
Bought by
32-34 Coyne Rd Rt and Devito John E
Purchase Details
Closed on
Apr 9, 1999
Sold by
Mag Rt and Golov Peter S
Bought by
Chung Tommy Y and Chung Lois W
Home Financials for this Owner
Home Financials are based on the most recent Mortgage that was taken out on this home.
Original Mortgage
$341,250
Interest Rate
6.83%
Mortgage Type
Purchase Money Mortgage
Purchase Details
Closed on
Jul 21, 1998
Sold by
Danmar Rt and Train Charles D
Bought by
Mag Rt and Golov Peter S
Home Financials for this Owner
Home Financials are based on the most recent Mortgage that was taken out on this home.
Original Mortgage
$498,000
Interest Rate
6.98%
Mortgage Type
Purchase Money Mortgage
Create a Home Valuation Report for This Property
The Home Valuation Report is an in-depth analysis detailing your home's value as well as a comparison with similar homes in the area
Home Values in the Area
Average Home Value in this Area
Purchase History
| Date | Buyer | Sale Price | Title Company |
|---|---|---|---|
| Michael V Lepie T 2014 | -- | -- | |
| 32-34 Coyne Rd Rt | $782,500 | -- | |
| Chung Tommy Y | $455,000 | -- | |
| Mag Rt | $460,000 | -- |
Source: Public Records
Mortgage History
| Date | Status | Borrower | Loan Amount |
|---|---|---|---|
| Previous Owner | Mag Rt | $350,000 | |
| Previous Owner | Mag Rt | $341,250 | |
| Previous Owner | Mag Rt | $498,000 |
Source: Public Records
Tax History
| Year | Tax Paid | Tax Assessment Tax Assessment Total Assessment is a certain percentage of the fair market value that is determined by local assessors to be the total taxable value of land and additions on the property. | Land | Improvement |
|---|---|---|---|---|
| 2025 | $14,369 | $1,466,200 | $1,145,600 | $320,600 |
| 2024 | $13,893 | $1,423,500 | $1,112,200 | $311,300 |
| 2023 | $13,276 | $1,304,100 | $917,400 | $386,700 |
| 2022 | $12,703 | $1,207,500 | $849,400 | $358,100 |
| 2021 | $11,364 | $1,107,800 | $779,300 | $328,500 |
| 2020 | $11,565 | $1,107,800 | $779,300 | $328,500 |
| 2019 | $10,819 | $1,035,300 | $728,300 | $307,000 |
| 2018 | $10,833 | $1,001,200 | $684,800 | $316,400 |
| 2017 | $10,214 | $918,500 | $628,300 | $290,200 |
| 2016 | $9,590 | $842,700 | $576,400 | $266,300 |
| 2015 | $9,144 | $787,600 | $538,700 | $248,900 |
Source: Public Records
Map
Nearby Homes
- 19 Gordon Rd
- 81 Fuller St
- 15 Gammons Rd
- 55 Evelyn Rd
- 18 Moffat Rd
- 155 Paulson Rd
- 1230 Commonwealth Ave
- 1438 Beacon St
- 20 Risley Rd
- 110 Avalon Rd
- 29 Montclair Rd
- 1151 Commonwealth Ave
- 115 Windsor Rd
- 97 Valentine St
- 126 Beethoven Ave
- 34 Larchmont Ave
- 20 Kinmonth Rd Unit 203
- 20 Kinmonth Rd Unit 306
- 20 Kinmonth Rd Unit 4
- 26 Sewall St
- 34 Coyne Rd Unit 1
- 34 Coyne Rd
- 28 Coyne Rd Unit 30
- 28 Coyne Rd Unit 28
- 28 Coyne Rd Unit A
- 30 Coyne Rd
- 30 Coyne Rd Unit 30
- 8-10 Coyne Rd
- 50 Gordon Rd
- 29 Coyne Rd
- 31 Coyne Rd
- 58 Paulson Rd
- 70 Helene Rd
- 42 Gordon Rd
- 64 Paulson Rd
- 51 Cotter Rd Unit 2
- 51 Cotter Rd Unit 1
- 51 Cotter Rd
- 21 Coyne Rd
- 12 Coyne Rd Unit 14
Your Personal Tour Guide
Ask me questions while you tour the home.