32 Elmira St Lockport, NY 14094
Estimated Value: $144,000 - $200,000
3
Beds
1
Bath
1,237
Sq Ft
$138/Sq Ft
Est. Value
About This Home
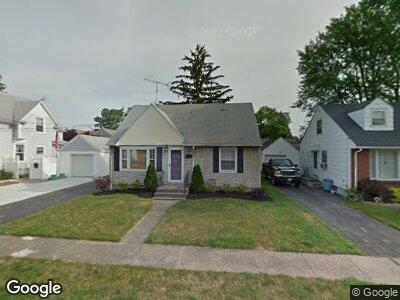
This home is located at 32 Elmira St, Lockport, NY 14094 and is currently estimated at $170,275, approximately $137 per square foot. 32 Elmira St is a home located in Niagara County with nearby schools including North Park Junior High School, Lockport High School, and DeSales Catholic School.
Ownership History
Date
Name
Owned For
Owner Type
Purchase Details
Closed on
Mar 4, 2024
Sold by
Coleman Beryl
Bought by
Coleman Megan
Current Estimated Value
Purchase Details
Closed on
Feb 17, 2012
Sold by
Giancola Teresa
Bought by
Coleman Beryl
Purchase Details
Closed on
Feb 7, 2012
Sold by
Niver Teresa A and Giancola Teresa E
Bought by
Coleman Beryl
Purchase Details
Closed on
Oct 23, 2009
Sold by
Bartenstein Laverne
Bought by
Giancola Teresa
Home Financials for this Owner
Home Financials are based on the most recent Mortgage that was taken out on this home.
Original Mortgage
$68,732
Interest Rate
5.09%
Mortgage Type
FHA
Purchase Details
Closed on
Oct 21, 2009
Sold by
Herbst Mary J
Bought by
Giancola Teresa E
Home Financials for this Owner
Home Financials are based on the most recent Mortgage that was taken out on this home.
Original Mortgage
$68,732
Interest Rate
5.09%
Mortgage Type
FHA
Create a Home Valuation Report for This Property
The Home Valuation Report is an in-depth analysis detailing your home's value as well as a comparison with similar homes in the area
Home Values in the Area
Average Home Value in this Area
Purchase History
| Date | Buyer | Sale Price | Title Company |
|---|---|---|---|
| Coleman Megan | -- | None Listed On Document | |
| Coleman Beryl | $73,000 | Charles Ben | |
| Coleman Beryl | $73,000 | None Available | |
| Giancola Teresa | $70,000 | Angela Stamm-Philips | |
| Giancola Teresa E | $70,000 | None Available |
Source: Public Records
Mortgage History
| Date | Status | Borrower | Loan Amount |
|---|---|---|---|
| Previous Owner | Giancola Teresa E | $68,732 |
Source: Public Records
Tax History Compared to Growth
Tax History
| Year | Tax Paid | Tax Assessment Tax Assessment Total Assessment is a certain percentage of the fair market value that is determined by local assessors to be the total taxable value of land and additions on the property. | Land | Improvement |
|---|---|---|---|---|
| 2024 | $3,746 | $139,000 | $4,800 | $134,200 |
| 2023 | $3,746 | $134,000 | $4,800 | $129,200 |
| 2022 | $2,867 | $120,000 | $4,800 | $115,200 |
| 2021 | $2,788 | $70,700 | $6,100 | $64,600 |
| 2020 | $2,728 | $70,700 | $6,100 | $64,600 |
| 2019 | $611 | $70,700 | $6,100 | $64,600 |
| 2018 | $1,972 | $70,700 | $6,100 | $64,600 |
| 2017 | $1,966 | $70,700 | $6,100 | $64,600 |
| 2016 | $1,903 | $70,700 | $6,100 | $64,600 |
| 2015 | -- | $70,700 | $6,100 | $64,600 |
| 2014 | -- | $70,700 | $6,100 | $64,600 |
Source: Public Records
Map
Nearby Homes