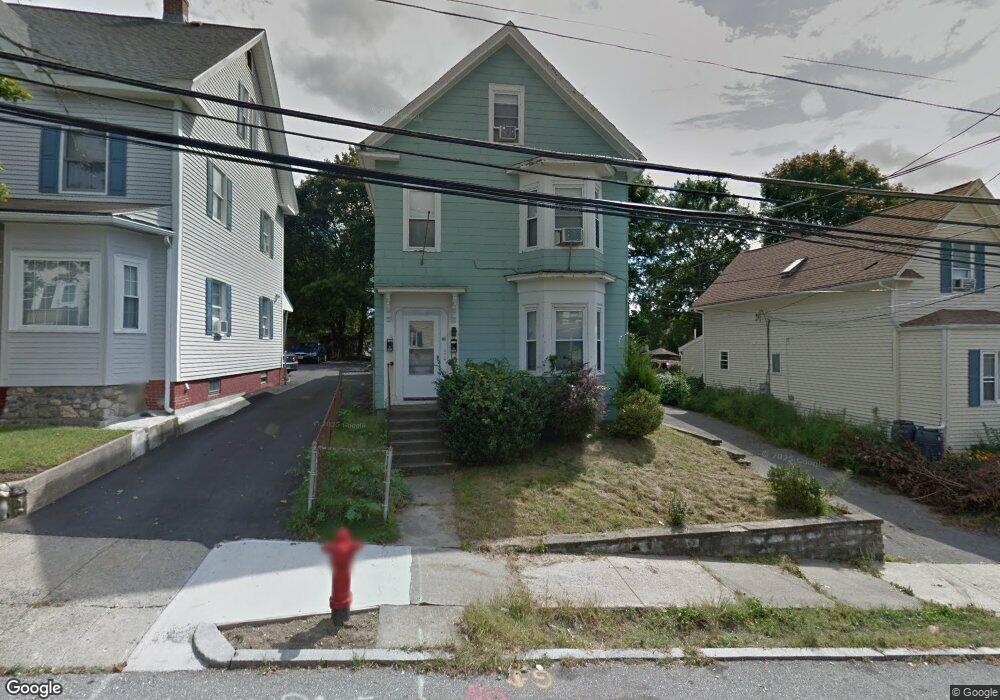
32 Richardson St Wakefield, MA 01880
East Side NeighborhoodEstimated Value: $715,000 - $836,000
4
Beds
2
Baths
2,086
Sq Ft
$374/Sq Ft
Est. Value
About This Home
This home is located at 32 Richardson St, Wakefield, MA 01880 and is currently estimated at $780,574, approximately $374 per square foot. 32 Richardson St is a home located in Middlesex County with nearby schools including Wakefield Memorial High School, St Joseph School, and Odyssey Day School.
Ownership History
Date
Name
Owned For
Owner Type
Purchase Details
Closed on
Jun 18, 2004
Sold by
Purcell Brian S and Purcell David R
Bought by
Purcell Tr Brian S and Purcell David R
Current Estimated Value
Purchase Details
Closed on
Jan 12, 1962
Bought by
Connelly William F
Create a Home Valuation Report for This Property
The Home Valuation Report is an in-depth analysis detailing your home's value as well as a comparison with similar homes in the area
Home Values in the Area
Average Home Value in this Area
Purchase History
| Date | Buyer | Sale Price | Title Company |
|---|---|---|---|
| Purcell Tr Brian S | -- | -- | |
| Connelly William F | -- | -- |
Source: Public Records
Mortgage History
| Date | Status | Borrower | Loan Amount |
|---|---|---|---|
| Previous Owner | Connelly William F | $50,000 |
Source: Public Records
Tax History Compared to Growth
Tax History
| Year | Tax Paid | Tax Assessment Tax Assessment Total Assessment is a certain percentage of the fair market value that is determined by local assessors to be the total taxable value of land and additions on the property. | Land | Improvement |
|---|---|---|---|---|
| 2025 | $7,878 | $694,100 | $336,500 | $357,600 |
| 2024 | $7,764 | $690,100 | $334,500 | $355,600 |
| 2023 | $7,383 | $629,400 | $305,100 | $324,300 |
| 2022 | $7,061 | $573,100 | $277,800 | $295,300 |
| 2021 | $6,755 | $530,600 | $259,000 | $271,600 |
| 2020 | $6,334 | $496,000 | $242,100 | $253,900 |
| 2019 | $6,051 | $471,600 | $230,200 | $241,400 |
| 2018 | $4,097 | $435,400 | $212,300 | $223,100 |
| 2017 | $5,302 | $406,900 | $198,400 | $208,500 |
| 2016 | $4,989 | $369,800 | $187,700 | $182,100 |
| 2015 | $4,659 | $345,600 | $175,400 | $170,200 |
| 2014 | $4,247 | $332,300 | $168,700 | $163,600 |
Source: Public Records
Map
Nearby Homes
- 22 Jefferson Rd
- 38 Bennett St Unit 3D
- 5 Bateman Ct Unit 5
- 51 Crescent St
- 134 Nahant St Unit B
- 16 Pleasant St
- 50 Albion St
- 62 Foundry St Unit 310
- 62 Foundry St Unit 312
- 62 Foundry St Unit 506
- 62 Foundry St Unit 202
- 62 Foundry St Unit 208
- 62 Foundry St Unit 414
- 62 Foundry St Unit 406
- 62 Foundry St Unit 313
- Unit 208 Plan at Wrenly
- Unit 310 Plan at Wrenly
- 69 Foundry St Unit 416
- 69 Foundry St Unit 310
- 9 Avon St Unit 2
- 30 Richardson St
- 34 Richardson St Unit 1
- 34 Richardson St
- 34 Richardson St
- 34 Richardson St Unit 2
- 28 Richardson St Unit 3
- 28 Richardson St Unit 2
- 28 Richardson St Unit 1
- 28 Richardson St Unit D
- 28 Richardson St Unit C
- 28 Richardson St Unit A
- 28 Richardson St
- 28 Richardson St Unit A (Left)
- 28 Richardson St Unit B
- 28B Richardson St Unit RIGHT
- 28A Richardson St Unit LEFT
- 31 Richardson St Unit 33
- 31 Richardson St Unit 31
- 36 Richardson St
- 36 Richardson St Unit Rear