
Landlord's Agent in 2024
Josh Brown
Berkshire Hathaway HomeServices Starck Real Estate
(815) 334-2613
40 Total Sales


Estimated Value: $252,000 - $308,000
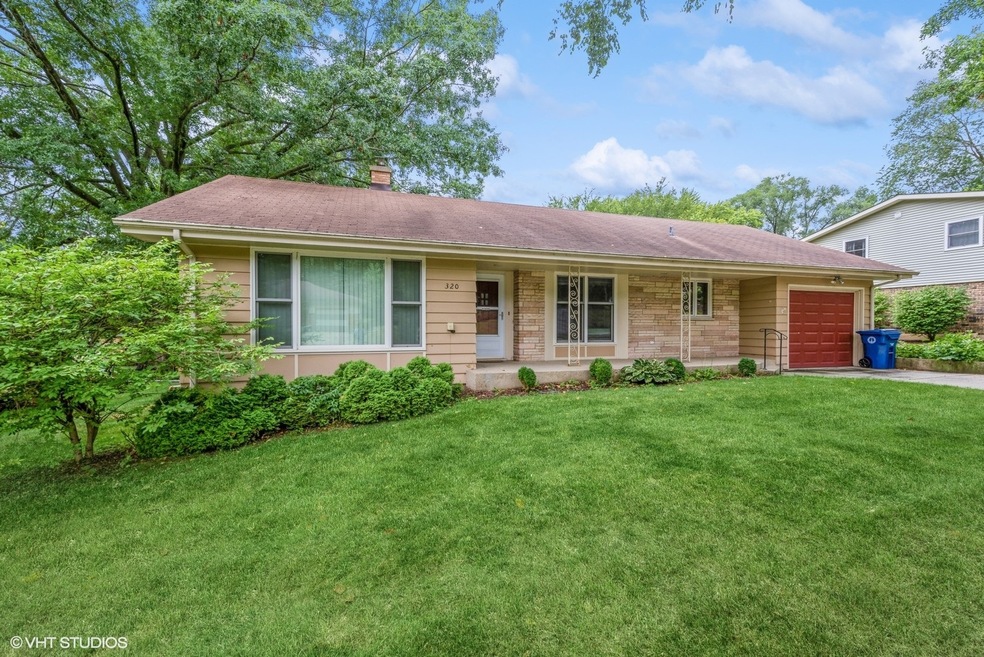
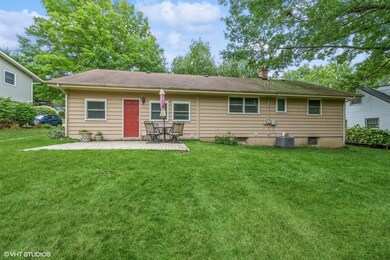
Walk to school, park, downtown, river. House is on quiet street with large back lawn and patio. NO Pets Following Requirements must be met Credit & Back Ground Check required for all adults over 18, cost is $53 non refundable. Applicant(s) MUST meet requirements of a 675 credit score, Owner requirers 3x income to Rent. Tenant pays all utilities, 1 year lease minimum. Non Smoking unit!. For more information or to apply call 8474852500. Previewing Sunday Morning 11-12pm CANCELED!
Last Agent to Rent the Property
Berkshire Hathaway HomeServices Starck Real Estate License #475157923 Listed on: 08/30/2024
| Date | Buyer | Sale Price | Title Company |
|---|---|---|---|
| The Chicago Trust Company N A | -- | Attorney | |
| Albany Bank & Trust Co Na | -- | -- | |
| Lasalle Bank Na | -- | -- | |
| Verunac James | -- | Chicago Title Insurance Co | |
| Verunac James | $98,500 | -- | |
| Martin Irma | -- | -- |
| Date | Event | Price | List to Sale | Price per Sq Ft |
|---|---|---|---|---|
| 09/09/2024 09/09/24 | Rented | $1,900 | 0.0% | -- |
| 09/09/2024 09/09/24 | Under Contract | -- | -- | -- |
| 08/30/2024 08/30/24 | For Rent | $1,900 | -- | -- |
| Year | Tax Paid | Tax Assessment Tax Assessment Total Assessment is a certain percentage of the fair market value that is determined by local assessors to be the total taxable value of land and additions on the property. | Land | Improvement |
|---|---|---|---|---|
| 2024 | $5,690 | $72,734 | $12,193 | $60,541 |
| 2023 | $5,446 | $65,051 | $10,905 | $54,146 |
| 2022 | $4,556 | $53,121 | $14,911 | $38,210 |
| 2021 | $4,391 | $49,488 | $13,891 | $35,597 |
| 2020 | $4,286 | $47,736 | $13,399 | $34,337 |
| 2019 | $4,195 | $45,689 | $12,824 | $32,865 |
| 2018 | $4,023 | $42,207 | $11,847 | $30,360 |
| 2017 | $3,960 | $39,762 | $11,161 | $28,601 |
| 2016 | $3,922 | $37,293 | $10,468 | $26,825 |
| 2013 | -- | $35,331 | $9,765 | $25,566 |
Landlord's Agent in 2024
Josh Brown
Berkshire Hathaway HomeServices Starck Real Estate
(815) 334-2613
40 Total Sales
N
Tenant's Agent in 2024
Nafis Noorali
AAA Real Estate
(630) 675-8085
31 Total Sales
Source: Midwest Real Estate Data (MRED)
MLS Number: 12145840
APN: 19-34-185-010
Disclaimer: Certain information contained herein is derived from information provided by parties other than Homes.com. All information provided is deemed reliable, but is not guaranteed to be accurate and should be independently verified.
![]() Based on information submitted to the MLS GRID. All data is obtained from various sources and may not have been verified by broker or MLS GRID. Supplied Open House Information is subject to change without notice. All information should be independently reviewed and verified for accuracy. Properties may or may not be listed by the office/agent presenting the information. Some IDX listings have been excluded from this website.
Based on information submitted to the MLS GRID. All data is obtained from various sources and may not have been verified by broker or MLS GRID. Supplied Open House Information is subject to change without notice. All information should be independently reviewed and verified for accuracy. Properties may or may not be listed by the office/agent presenting the information. Some IDX listings have been excluded from this website.
Based on information submitted to the MLS GRID
Ask me questions while you tour the home.