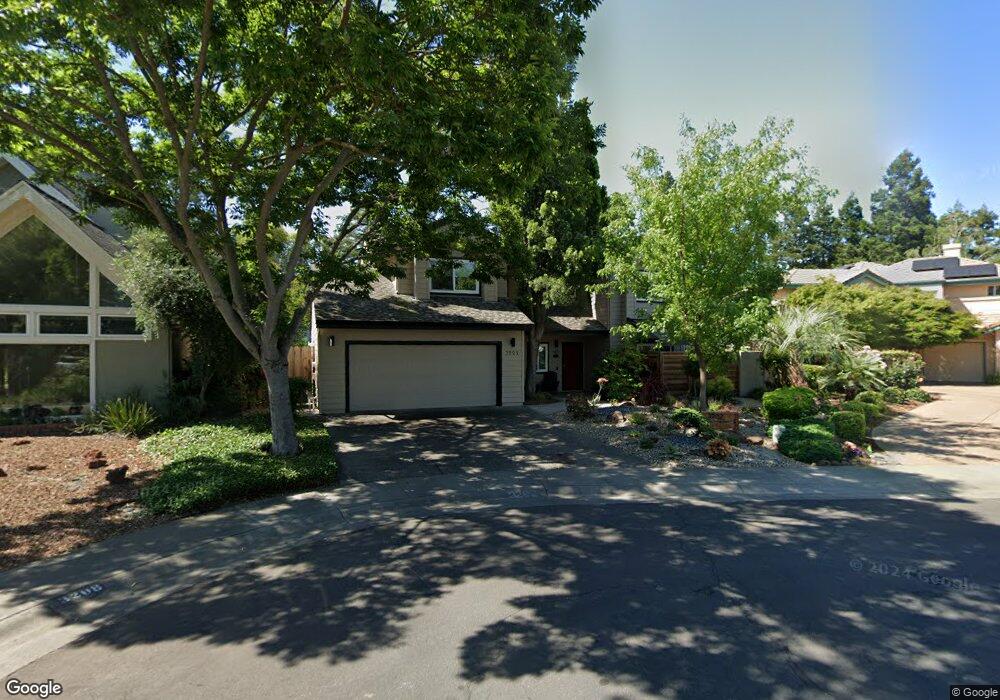
3202 Grosbeak Ct Davis, CA 95616
North Davis NeighborhoodEstimated Value: $1,016,000 - $1,092,000
3
Beds
4
Baths
2,353
Sq Ft
$443/Sq Ft
Est. Value
About This Home
This home is located at 3202 Grosbeak Ct, Davis, CA 95616 and is currently estimated at $1,042,900, approximately $443 per square foot. 3202 Grosbeak Ct is a home located in Yolo County with nearby schools including North Davis Elementary School, Oliver Wendell Holmes Junior High School, and Davis Senior High School.
Ownership History
Date
Name
Owned For
Owner Type
Purchase Details
Closed on
Aug 19, 2016
Sold by
Higgins Brian and Mansfield Sandra
Bought by
Higgins Brian and Higgins Sandra Mansfield
Current Estimated Value
Home Financials for this Owner
Home Financials are based on the most recent Mortgage that was taken out on this home.
Original Mortgage
$234,000
Interest Rate
3.45%
Mortgage Type
New Conventional
Purchase Details
Closed on
May 16, 2012
Sold by
Higgins Brian and Mansfield Sandra
Bought by
Higgins Brian and Higgins Sandra Mansfield
Home Financials for this Owner
Home Financials are based on the most recent Mortgage that was taken out on this home.
Original Mortgage
$251,000
Interest Rate
3.85%
Mortgage Type
New Conventional
Purchase Details
Closed on
Mar 22, 2005
Sold by
Higgins Brian G
Bought by
Higgins Brian and Higgins Sandra Mansfield
Create a Home Valuation Report for This Property
The Home Valuation Report is an in-depth analysis detailing your home's value as well as a comparison with similar homes in the area
Home Values in the Area
Average Home Value in this Area
Purchase History
| Date | Buyer | Sale Price | Title Company |
|---|---|---|---|
| Higgins Brian | -- | None Available | |
| Hioggins Brian | -- | None Available | |
| Higgins Brian | -- | Accommodation | |
| Higgins Brian | -- | Lsi | |
| Higgins Brian | -- | -- |
Source: Public Records
Mortgage History
| Date | Status | Borrower | Loan Amount |
|---|---|---|---|
| Closed | Hioggins Brian | $234,000 | |
| Closed | Higgins Brian | $251,000 |
Source: Public Records
Tax History
| Year | Tax Paid | Tax Assessment Tax Assessment Total Assessment is a certain percentage of the fair market value that is determined by local assessors to be the total taxable value of land and additions on the property. | Land | Improvement |
|---|---|---|---|---|
| 2025 | $6,606 | $573,825 | $167,936 | $405,889 |
| 2023 | $6,606 | $551,545 | $161,416 | $390,129 |
| 2022 | $7,442 | $540,731 | $158,251 | $382,480 |
| 2021 | $7,274 | $530,130 | $155,149 | $374,981 |
| 2020 | $7,573 | $524,696 | $153,559 | $371,137 |
| 2019 | $7,256 | $514,409 | $150,549 | $363,860 |
| 2018 | $6,810 | $504,324 | $147,598 | $356,726 |
| 2017 | $6,697 | $494,436 | $144,704 | $349,732 |
| 2016 | $6,545 | $484,742 | $141,867 | $342,875 |
| 2015 | $6,455 | $477,462 | $139,737 | $337,725 |
| 2014 | $6,358 | $468,110 | $137,000 | $331,110 |
Source: Public Records
Map
Nearby Homes
- 416 Merganser Place
- 2818 Anza Ave
- 116 Huerta Place
- 114 Guaymas Place
- 2502 Amapola Dr
- 2181 Bella Casa St
- 2007 Alta Loma St
- 2230 Cannery Loop
- 2128 Bueno Dr Unit 18
- 2248 Cannery Loop
- 1731 Heirloom St
- 1661 Spring St Unit 411
- 1661 Spring St Unit 424
- 1661 Spring St Unit 444
- 1661 Spring St Unit 341
- 1577 Drake Dr
- 1000 Berryessa Ln Unit 211
- 1522 Orange Ln
- 24130 County Road 101a
- 1302 Oak Ave
- 3208 Grosbeak Ct
- 3203 Grosbeak Ct
- 521 Flicker Ave
- 515 Flicker Ave
- 527 Flicker Ave
- 3215 Grosbeak Ct
- 509 Flicker Ave
- 529 Flicker Ave
- 3209 Grosbeak Ct
- 3214 Grosbeak Ct
- 3221 Grosbeak Ct
- 3220 Grosbeak Ct
- 533 Flicker Ave
- 503 Flicker Ave
- 504 Oriole Ave
- 3226 Grosbeak Ct
- 539 Flicker Ave
- 520 Flicker Ave
- 514 Flicker Ave
- 526 Flicker Ave
Your Personal Tour Guide
Ask me questions while you tour the home.