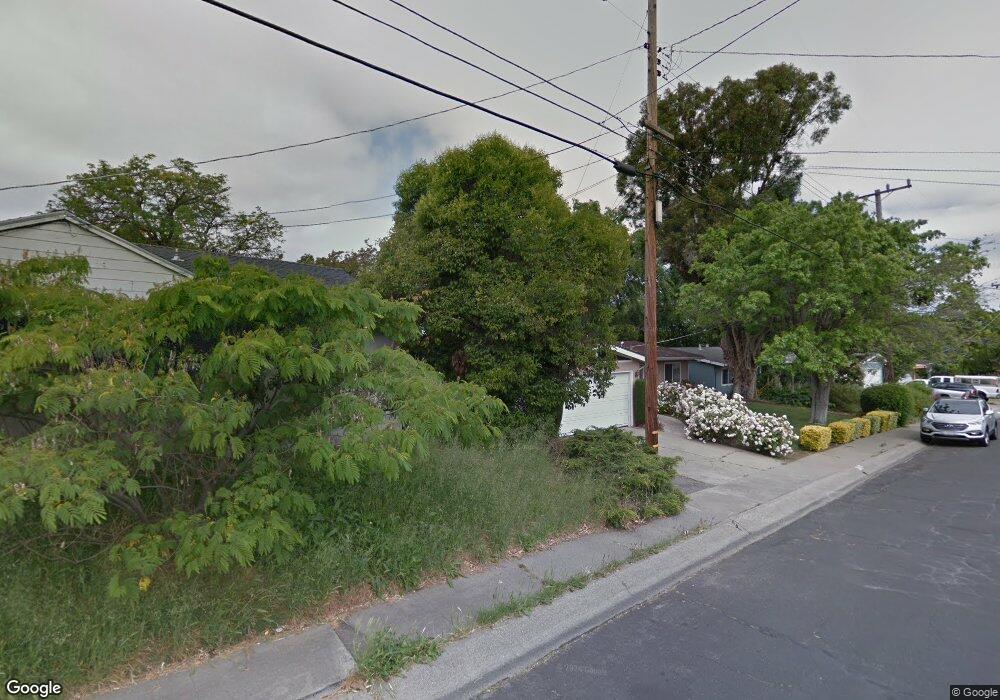
3207 Claudia Dr Concord, CA 94519
Holbrook Heights NeighborhoodEstimated Value: $634,000 - $750,000
4
Beds
2
Baths
1,478
Sq Ft
$461/Sq Ft
Est. Value
About This Home
This home is located at 3207 Claudia Dr, Concord, CA 94519 and is currently estimated at $680,737, approximately $460 per square foot. 3207 Claudia Dr is a home located in Contra Costa County with nearby schools including Holbrook Language Academy, El Dorado Middle School, and Mt. Diablo High School.
Ownership History
Date
Name
Owned For
Owner Type
Purchase Details
Closed on
Oct 10, 2005
Sold by
Sosa Irma Leticia
Bought by
Sosa Irma Leticia
Current Estimated Value
Home Financials for this Owner
Home Financials are based on the most recent Mortgage that was taken out on this home.
Original Mortgage
$333,000
Interest Rate
1%
Mortgage Type
Negative Amortization
Purchase Details
Closed on
Aug 9, 2004
Sold by
Sosa Mauricio R
Bought by
Sosa Irma Leticia
Home Financials for this Owner
Home Financials are based on the most recent Mortgage that was taken out on this home.
Original Mortgage
$160,000
Interest Rate
5.87%
Mortgage Type
Stand Alone Refi Refinance Of Original Loan
Create a Home Valuation Report for This Property
The Home Valuation Report is an in-depth analysis detailing your home's value as well as a comparison with similar homes in the area
Home Values in the Area
Average Home Value in this Area
Purchase History
| Date | Buyer | Sale Price | Title Company |
|---|---|---|---|
| Sosa Irma Leticia | -- | Ticor Title Company | |
| Sosa Irma Leticia | -- | Fidelity National Title |
Source: Public Records
Mortgage History
| Date | Status | Borrower | Loan Amount |
|---|---|---|---|
| Closed | Sosa Irma Leticia | $333,000 | |
| Closed | Sosa Irma Leticia | $160,000 |
Source: Public Records
Tax History
| Year | Tax Paid | Tax Assessment Tax Assessment Total Assessment is a certain percentage of the fair market value that is determined by local assessors to be the total taxable value of land and additions on the property. | Land | Improvement |
|---|---|---|---|---|
| 2025 | $3,530 | $234,985 | $95,689 | $139,296 |
| 2024 | $3,341 | $230,378 | $93,813 | $136,565 |
| 2023 | $3,341 | $225,862 | $91,974 | $133,888 |
| 2022 | $3,274 | $221,434 | $90,171 | $131,263 |
| 2021 | $3,179 | $217,093 | $88,403 | $128,690 |
| 2019 | $3,102 | $210,656 | $85,782 | $124,874 |
| 2018 | $2,974 | $206,526 | $84,100 | $122,426 |
| 2017 | $2,861 | $202,477 | $82,451 | $120,026 |
| 2016 | $2,758 | $198,508 | $80,835 | $117,673 |
| 2015 | $2,700 | $195,527 | $79,621 | $115,906 |
| 2014 | $2,628 | $191,698 | $78,062 | $113,636 |
Source: Public Records
Map
Nearby Homes
- 3185 Claudia Dr
- 2219 Acacia Dr
- 2261 Gehringer Dr
- 2137 Holbrook Dr
- 3354 Ronald Way
- 2780 Argyll Ave
- 2766 Argyll Ave
- 2102 Overhill Rd
- 3355 Bennett Way
- 2816 Glenside Dr
- 2579 Montgomery Ave
- 2108 Roskelley Dr
- 2105 Holbrook Dr
- 3485 Hillsborough Dr
- 2479 Pacheco St
- 3155 San Ramon Rd
- 2640 Wisteria Way
- 2913 Richard Ave
- 2831 Richard Ave
- 3583 Dumbarton St
Your Personal Tour Guide
Ask me questions while you tour the home.