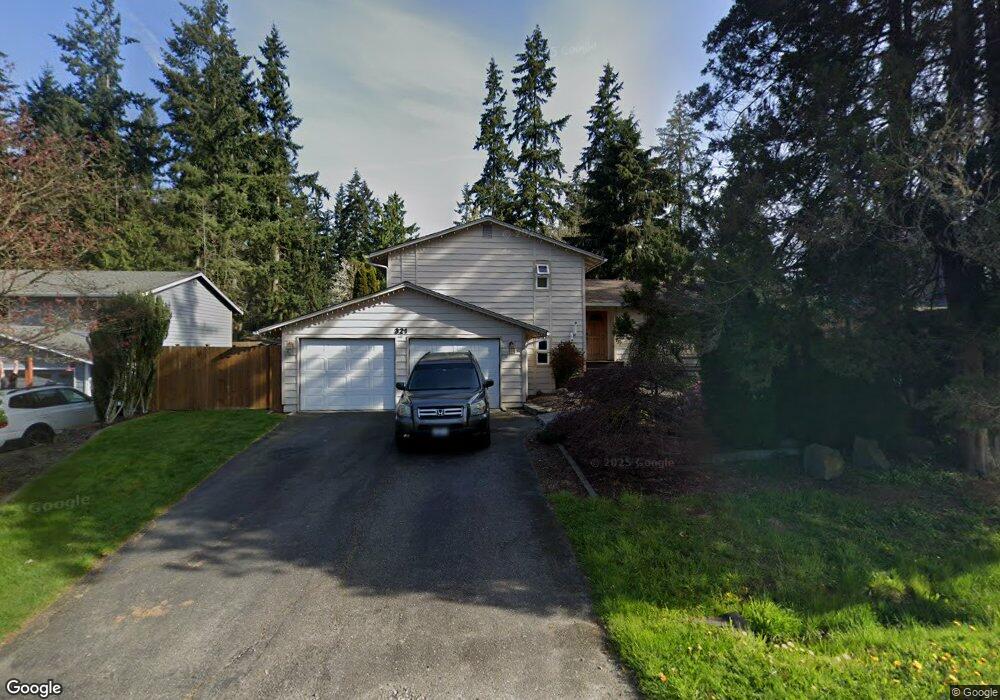
321 176th Place SW Bothell, WA 98012
Estimated Value: $758,000 - $950,000
3
Beds
3
Baths
1,884
Sq Ft
$450/Sq Ft
Est. Value
About This Home
This home is located at 321 176th Place SW, Bothell, WA 98012 and is currently estimated at $848,516, approximately $450 per square foot. 321 176th Place SW is a home located in Snohomish County with nearby schools including Martha Lake Elementary School, Alderwood Middle School, and Lynnwood High School.
Ownership History
Date
Name
Owned For
Owner Type
Purchase Details
Closed on
Sep 16, 2020
Sold by
Thompson Marc E and Thompson Cindy M
Bought by
Thompson Cindy M and Thompson Marc E
Current Estimated Value
Home Financials for this Owner
Home Financials are based on the most recent Mortgage that was taken out on this home.
Original Mortgage
$242,000
Outstanding Balance
$189,618
Interest Rate
2.9%
Mortgage Type
New Conventional
Estimated Equity
$658,898
Purchase Details
Closed on
Jul 7, 2000
Sold by
Gerhardt Gerald Lee and Gerhardt Sylvia M
Bought by
Thompson Marc E and Thompson Cindy M
Home Financials for this Owner
Home Financials are based on the most recent Mortgage that was taken out on this home.
Original Mortgage
$201,000
Interest Rate
7.1%
Create a Home Valuation Report for This Property
The Home Valuation Report is an in-depth analysis detailing your home's value as well as a comparison with similar homes in the area
Home Values in the Area
Average Home Value in this Area
Purchase History
| Date | Buyer | Sale Price | Title Company |
|---|---|---|---|
| Thompson Cindy M | -- | Chicago Title | |
| Thompson Marc E | $224,000 | -- |
Source: Public Records
Mortgage History
| Date | Status | Borrower | Loan Amount |
|---|---|---|---|
| Open | Thompson Cindy M | $242,000 | |
| Closed | Thompson Marc E | $201,000 |
Source: Public Records
Tax History
| Year | Tax Paid | Tax Assessment Tax Assessment Total Assessment is a certain percentage of the fair market value that is determined by local assessors to be the total taxable value of land and additions on the property. | Land | Improvement |
|---|---|---|---|---|
| 2026 | $5,890 | $768,700 | $510,000 | $258,700 |
| 2025 | $5,657 | $710,300 | $450,000 | $260,300 |
| 2024 | $5,657 | $679,200 | $430,000 | $249,200 |
| 2023 | $6,091 | $766,200 | $485,000 | $281,200 |
| 2022 | $5,650 | $578,400 | $339,000 | $239,400 |
| 2020 | $5,376 | $486,400 | $273,000 | $213,400 |
| 2019 | $4,911 | $441,700 | $235,000 | $206,700 |
| 2018 | $5,116 | $405,900 | $217,000 | $188,900 |
| 2017 | $4,084 | $334,300 | $155,000 | $179,300 |
| 2016 | $3,863 | $317,200 | $144,000 | $173,200 |
| 2015 | $3,803 | $296,700 | $136,000 | $160,700 |
| 2013 | $3,369 | $249,200 | $110,000 | $139,200 |
Source: Public Records
Map
Nearby Homes
- 24 174th Place SW
- 17419 Gravenstein Rd
- 118 171st Place SW Unit B
- 17630 Larch Way
- 17606 Larch Way
- 110 169th Place SW Unit A
- 110 169th Place SW Unit B
- 118 169th Place SW Unit B
- 114 169th Place SW Unit B
- 207 169th Place SW
- 16918 6th Ave W
- 0 Adjacent To Baldwin Rd
- 16820 6th Ave W Unit B11
- 115 170th St SE
- 17407 3rd Ave SE
- 314 181st St SE
- 225 182nd Place SE
- 306 182nd Place SE
- 17210 4th Dr SE
- 16817 Larch Way Unit F101
- 329 176th Place SW
- 315 176th Place SW
- 318 175th Place SW
- 307 176th Place SW
- 322 175th Place SW
- 409 176th Place SW
- 316 176th Place SW
- 328 176th Place SW
- 231 176th Place SW
- 306 176th Place SW
- 17526 North Rd
- 326 175th Place SW
- 310 175th Place SW
- 17627 4th Place W
- 311 178th St SW
- 228 176th Place SW
- 17702 North Rd
- 421 176th Place SW
- 17703 4th Place W
- 17521 5th Ave W
Your Personal Tour Guide
Ask me questions while you tour the home.