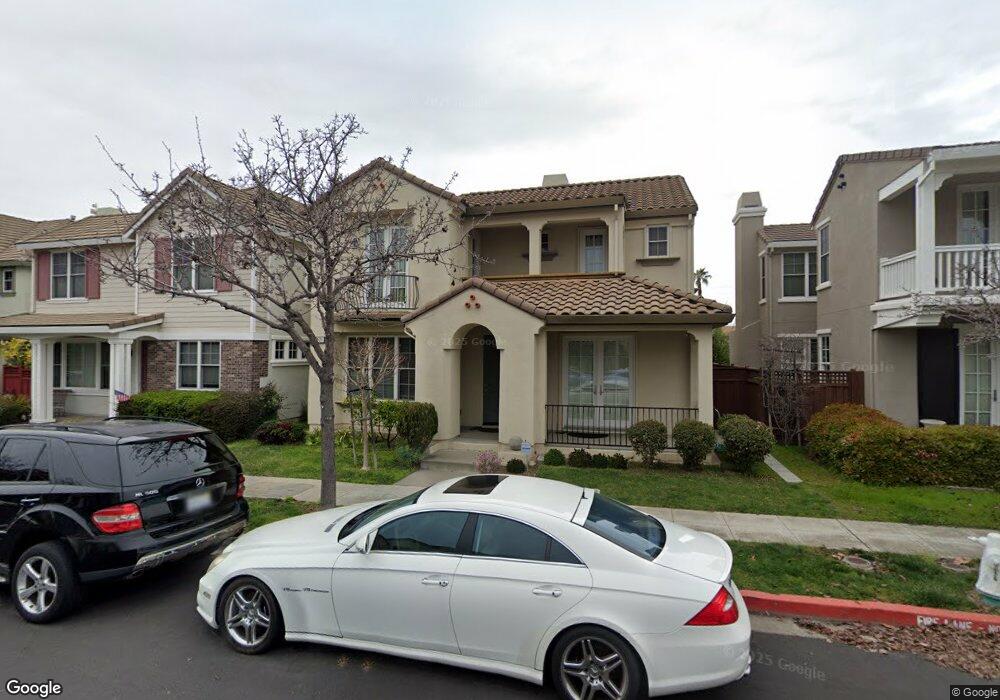
321 Ansel Ave Alameda, CA 94501
West Alameda NeighborhoodEstimated Value: $1,259,000 - $1,452,103
4
Beds
3
Baths
2,219
Sq Ft
$626/Sq Ft
Est. Value
About This Home
This home is located at 321 Ansel Ave, Alameda, CA 94501 and is currently estimated at $1,389,526, approximately $626 per square foot. 321 Ansel Ave is a home located in Alameda County with nearby schools including Ruby Bridges Elementary School, Encinal Junior/Senior High, and The Academy of Alameda TK-8 School.
Ownership History
Date
Name
Owned For
Owner Type
Purchase Details
Closed on
Jan 19, 2007
Sold by
Bayport Alameda Associates Llc
Bought by
Pan Guohua J and Hoang Jenna Yen
Current Estimated Value
Home Financials for this Owner
Home Financials are based on the most recent Mortgage that was taken out on this home.
Original Mortgage
$669,650
Outstanding Balance
$399,735
Interest Rate
6.19%
Mortgage Type
Purchase Money Mortgage
Estimated Equity
$989,791
Create a Home Valuation Report for This Property
The Home Valuation Report is an in-depth analysis detailing your home's value as well as a comparison with similar homes in the area
Home Values in the Area
Average Home Value in this Area
Purchase History
| Date | Buyer | Sale Price | Title Company |
|---|---|---|---|
| Pan Guohua J | $838,000 | First American Title Co |
Source: Public Records
Mortgage History
| Date | Status | Borrower | Loan Amount |
|---|---|---|---|
| Open | Pan Guohua J | $669,650 |
Source: Public Records
Tax History
| Year | Tax Paid | Tax Assessment Tax Assessment Total Assessment is a certain percentage of the fair market value that is determined by local assessors to be the total taxable value of land and additions on the property. | Land | Improvement |
|---|---|---|---|---|
| 2025 | $16,833 | $1,122,115 | $336,661 | $785,454 |
| 2024 | $16,833 | $1,100,120 | $330,062 | $770,058 |
| 2023 | $16,222 | $1,078,551 | $323,591 | $754,960 |
| 2022 | $16,488 | $1,057,410 | $317,248 | $740,162 |
| 2021 | $16,120 | $1,036,679 | $311,028 | $725,651 |
| 2020 | $15,697 | $1,026,050 | $307,839 | $718,211 |
| 2019 | $14,987 | $1,005,940 | $301,806 | $704,134 |
| 2018 | $14,605 | $986,223 | $295,890 | $690,333 |
| 2017 | $13,940 | $966,891 | $290,090 | $676,801 |
| 2016 | $13,935 | $947,936 | $284,403 | $663,533 |
| 2015 | $12,764 | $840,000 | $252,000 | $588,000 |
| 2014 | $11,892 | $797,000 | $239,100 | $557,900 |
Source: Public Records
Map
Nearby Homes
- 416 Bohol Circle Ln
- 142 Coronado Ave
- 406 Mosley Ave
- 1815 2nd St
- 313 Spruce St
- 1820 3rd St
- 1808 Main St
- 310 Spruce St
- 109 Cypress St Unit C
- 108 Cypress St Unit D
- 2870 Derbyline Ln
- 318 Cypress St Unit D
- 221 Pacific Ave
- 538 Martin Mariner Ave
- 477 Mitchell Ave
- 1 Avocet Ct
- 333 Central Ave
- 2180 Barnes Wharf Ln
- 2058 Barnes Wharf Ln
- 1834 8th St
Your Personal Tour Guide
Ask me questions while you tour the home.