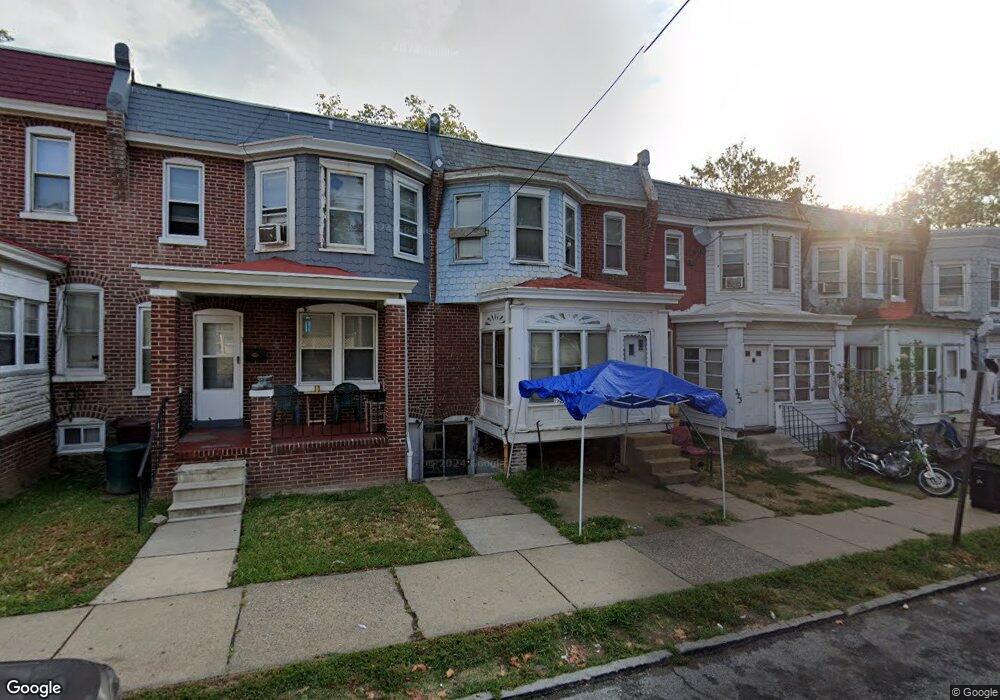
321 E 24th St Wilmington, DE 19802
Vandever Avenue NeighborhoodEstimated Value: $105,000 - $213,000
3
Beds
1
Bath
1,064
Sq Ft
$152/Sq Ft
Est. Value
About This Home
This home is located at 321 E 24th St, Wilmington, DE 19802 and is currently estimated at $161,830, approximately $152 per square foot. 321 E 24th St is a home with nearby schools including Hanby Elementary School, Springer Middle School, and Mount Pleasant High School.
Ownership History
Date
Name
Owned For
Owner Type
Purchase Details
Closed on
Nov 28, 2025
Sold by
Roberts Francis L
Bought by
Spre Llc
Current Estimated Value
Home Financials for this Owner
Home Financials are based on the most recent Mortgage that was taken out on this home.
Original Mortgage
$154,000
Outstanding Balance
$153,708
Interest Rate
6.27%
Mortgage Type
New Conventional
Estimated Equity
$8,122
Purchase Details
Closed on
Aug 1, 1987
Bought by
Roberts Francis L
Create a Home Valuation Report for This Property
The Home Valuation Report is an in-depth analysis detailing your home's value as well as a comparison with similar homes in the area
Home Values in the Area
Average Home Value in this Area
Purchase History
| Date | Buyer | Sale Price | Title Company |
|---|---|---|---|
| Spre Llc | $50,000 | None Listed On Document | |
| Roberts Francis L | $20,000 | -- |
Source: Public Records
Mortgage History
| Date | Status | Borrower | Loan Amount |
|---|---|---|---|
| Open | Spre Llc | $154,000 |
Source: Public Records
Tax History
| Year | Tax Paid | Tax Assessment Tax Assessment Total Assessment is a certain percentage of the fair market value that is determined by local assessors to be the total taxable value of land and additions on the property. | Land | Improvement |
|---|---|---|---|---|
| 2024 | $659 | $20,400 | $2,200 | $18,200 |
| 2023 | $598 | $20,400 | $2,200 | $18,200 |
| 2022 | $605 | $20,400 | $2,200 | $18,200 |
| 2021 | $604 | $20,400 | $2,200 | $18,200 |
| 2020 | $605 | $20,400 | $2,200 | $18,200 |
| 2019 | $1,015 | $20,400 | $2,200 | $18,200 |
| 2018 | $585 | $20,400 | $2,200 | $18,200 |
| 2017 | $581 | $20,400 | $2,200 | $18,200 |
| 2016 | $580 | $20,400 | $2,200 | $18,200 |
| 2015 | $905 | $20,400 | $2,200 | $18,200 |
| 2014 | $905 | $20,400 | $2,200 | $18,200 |
Source: Public Records
Map
Nearby Homes
- 2305 Jessup St
- 209 E 25th St
- 308 E 23rd St
- 2401 Carter St
- 2313 Carter St
- 26 E 24th St
- 19 E 25th St
- 31 E 23rd St
- 2230 Lamotte St
- 2203 N Pine St
- 217 E 22nd St
- 606 E 22nd St
- 2 E 24th St
- 2705 Speakman Place
- 2318 N Market St
- 2314 N Market St
- 2300 N Market St
- 724 E 22nd St
- 802 E 22nd St
- Single Family on E 29th St
Your Personal Tour Guide
Ask me questions while you tour the home.