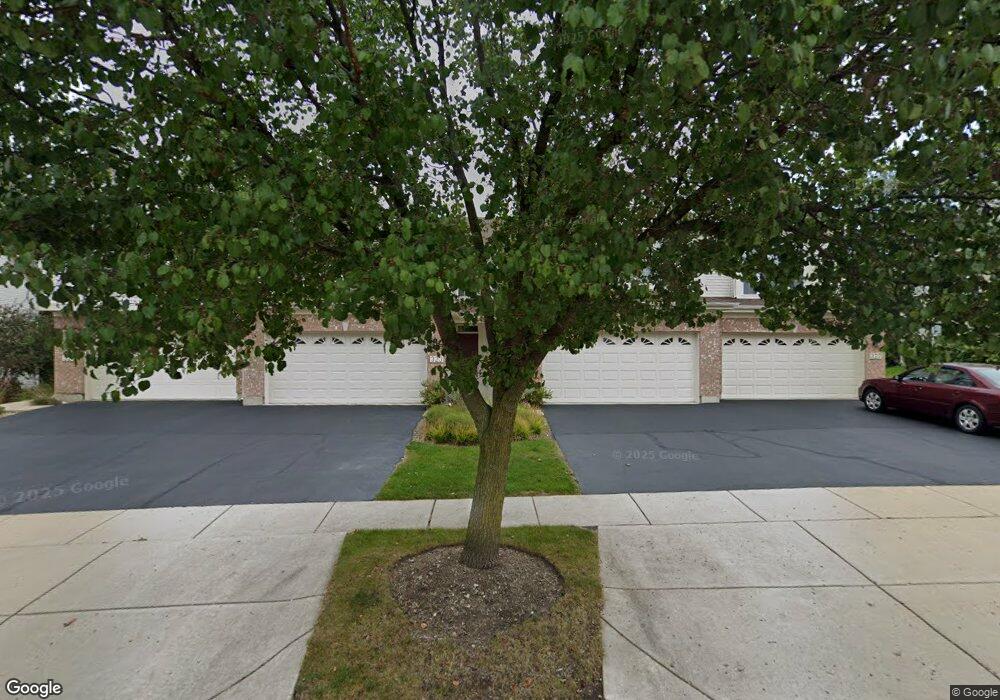
321 Emerald Ln Unit 31 Algonquin, IL 60102
Estimated Value: $308,637 - $341,000
2
Beds
--
Bath
1,778
Sq Ft
$186/Sq Ft
Est. Value
About This Home
This home is located at 321 Emerald Ln Unit 31, Algonquin, IL 60102 and is currently estimated at $331,159, approximately $186 per square foot. 321 Emerald Ln Unit 31 is a home located in Kane County with nearby schools including Algonquin Lakes Elementary School, Algonquin Middle School, and Dundee-Crown High School.
Ownership History
Date
Name
Owned For
Owner Type
Purchase Details
Closed on
Jun 24, 2005
Sold by
Caltagirone Anthony J
Bought by
Rajarathinam Saravanan S and Arumugam Sitalakshmi
Current Estimated Value
Home Financials for this Owner
Home Financials are based on the most recent Mortgage that was taken out on this home.
Original Mortgage
$234,000
Outstanding Balance
$120,591
Interest Rate
5.86%
Mortgage Type
Fannie Mae Freddie Mac
Estimated Equity
$210,568
Purchase Details
Closed on
Jan 20, 2002
Sold by
Realen Homes L P
Bought by
Caltagirone Anthony J
Home Financials for this Owner
Home Financials are based on the most recent Mortgage that was taken out on this home.
Original Mortgage
$135,000
Interest Rate
5.62%
Create a Home Valuation Report for This Property
The Home Valuation Report is an in-depth analysis detailing your home's value as well as a comparison with similar homes in the area
Purchase History
| Date | Buyer | Sale Price | Title Company |
|---|---|---|---|
| Rajarathinam Saravanan S | $247,000 | Ticor Title Insurance Co | |
| Caltagirone Anthony J | $215,500 | Chicago Title Insurance Co |
Source: Public Records
Mortgage History
| Date | Status | Borrower | Loan Amount |
|---|---|---|---|
| Open | Rajarathinam Saravanan S | $234,000 | |
| Previous Owner | Caltagirone Anthony J | $135,000 |
Source: Public Records
Tax History
| Year | Tax Paid | Tax Assessment Tax Assessment Total Assessment is a certain percentage of the fair market value that is determined by local assessors to be the total taxable value of land and additions on the property. | Land | Improvement |
|---|---|---|---|---|
| 2024 | $5,838 | $84,789 | $8,371 | $76,418 |
| 2023 | $5,558 | $76,290 | $7,532 | $68,758 |
| 2022 | $5,652 | $73,635 | $7,532 | $66,103 |
| 2021 | $5,478 | $69,526 | $7,112 | $62,414 |
| 2020 | $5,368 | $67,963 | $6,952 | $61,011 |
| 2019 | $5,196 | $64,518 | $6,600 | $57,918 |
| 2018 | $5,079 | $61,081 | $6,469 | $54,612 |
| 2017 | $4,862 | $57,138 | $6,051 | $51,087 |
| 2016 | $4,980 | $55,324 | $5,859 | $49,465 |
| 2015 | $5,924 | $51,840 | $5,490 | $46,350 |
| 2014 | $5,924 | $47,376 | $5,338 | $42,038 |
| 2013 | $5,924 | $48,826 | $5,501 | $43,325 |
Source: Public Records
Map
Nearby Homes
- 2150 E Algonquin Rd
- 1923 Ozark Pkwy
- 2027 Teton Pkwy
- Lot 4 b Ryan Pkwy
- 1770 E Algonquin Rd
- 1906 Ozark Pkwy
- 1782 Cumberland Pkwy
- 2 Cumberland Pkwy
- 1321 Big Sur Pkwy
- 1420 Greenridge Ave
- 1670 Yosemite Pkwy
- 6526 Marble Ln Unit 1033
- 2332 Flagstone Ln Unit 26
- 1361 Yosemite Pkwy
- 417 Silverstone Dr Unit 417
- 2113 Elgin Rd
- 1031 Timberwood Ln
- 2014 Limestone Ln Unit 245
- 719 Webster St
- 1613 Silverstone Dr Unit 1613
- 357 Emerald Ln Unit 64
- 381 Emerald Ln
- 325 Emerald Ln Unit 33
- 363 Emerald Ln Unit 7/2
- 347 Emerald Ln Unit 4
- 335 Emerald Ln Unit 43
- 377 Emerald Ln Unit 84
- 327 Emerald Ln
- 367 Emerald Ln Unit 74
- 343 Emerald Ln Unit 5/2
- 331 Emerald Ln Unit 41
- 341 Emerald Ln Unit 5/1
- 323 Emerald Ln Unit 32
- 345 Emerald Ln Unit 53
- 353 Emerald Ln Unit 62
- 385 Emerald Ln Unit 93
- 313 Emerald Ln Unit 22
- 355 Emerald Ln Unit 6/3
- 337 Emerald Ln Unit 44
- 383 Emerald Ln Unit 9/2
Your Personal Tour Guide
Ask me questions while you tour the home.