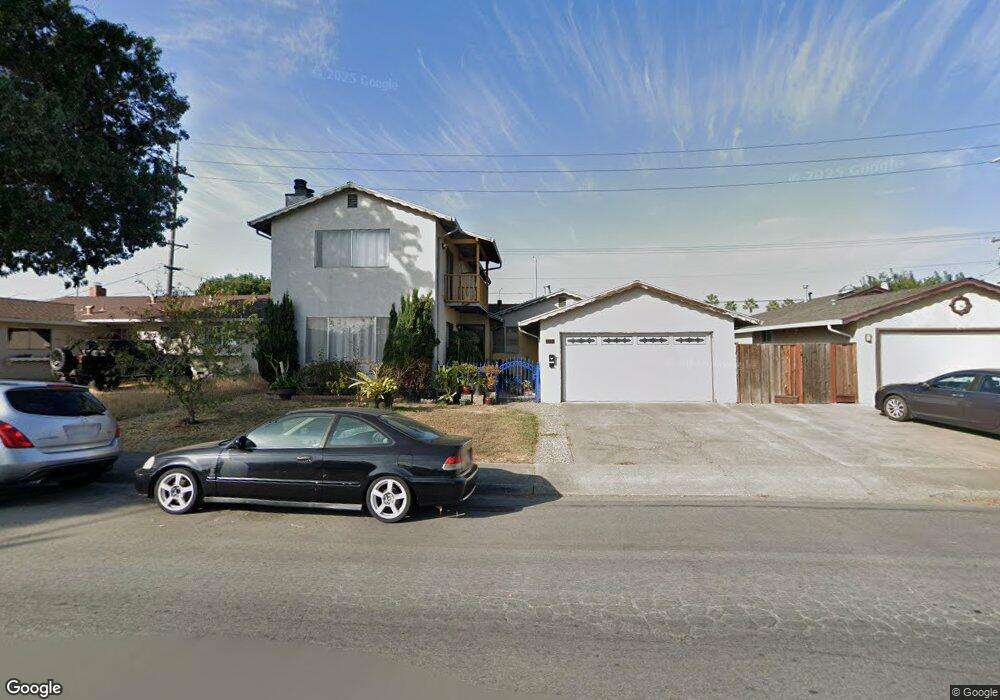
321 Heath St Milpitas, CA 95035
Estimated Value: $1,514,000 - $1,729,000
5
Beds
2
Baths
980
Sq Ft
$1,703/Sq Ft
Est. Value
About This Home
This home is located at 321 Heath St, Milpitas, CA 95035 and is currently estimated at $1,669,359, approximately $1,703 per square foot. 321 Heath St is a home located in Santa Clara County with nearby schools including Anthony Spangler Elementary School, Thomas Russell Middle School, and Milpitas High School.
Ownership History
Date
Name
Owned For
Owner Type
Purchase Details
Closed on
Sep 7, 2008
Sold by
Lam Van Thuy and Lam Tommy Phuong
Bought by
Lam Van Thuy
Current Estimated Value
Purchase Details
Closed on
Aug 31, 2006
Sold by
Lam Van Thuy
Bought by
Living Trust Of Van Thuy Lam
Purchase Details
Closed on
Apr 16, 2001
Sold by
Lam Van Thuy and Lam Tommy Phuong
Bought by
Lam Van Thuy and Lam Tommy Phuong
Home Financials for this Owner
Home Financials are based on the most recent Mortgage that was taken out on this home.
Original Mortgage
$217,000
Interest Rate
6.98%
Purchase Details
Closed on
Apr 27, 1998
Sold by
Marion Labutski
Bought by
Lam Van Thuy and Lam Tommy Phuong
Home Financials for this Owner
Home Financials are based on the most recent Mortgage that was taken out on this home.
Original Mortgage
$223,200
Interest Rate
7.06%
Create a Home Valuation Report for This Property
The Home Valuation Report is an in-depth analysis detailing your home's value as well as a comparison with similar homes in the area
Home Values in the Area
Average Home Value in this Area
Purchase History
| Date | Buyer | Sale Price | Title Company |
|---|---|---|---|
| Lam Van Thuy | $3,000 | None Available | |
| Living Trust Of Van Thuy Lam | -- | None Available | |
| Lam Van Thuy | $72,500 | Alliance Title Company | |
| Lam Van Thuy | $279,000 | Old Republic Title Company |
Source: Public Records
Mortgage History
| Date | Status | Borrower | Loan Amount |
|---|---|---|---|
| Previous Owner | Lam Van Thuy | $217,000 | |
| Previous Owner | Lam Van Thuy | $223,200 |
Source: Public Records
Tax History
| Year | Tax Paid | Tax Assessment Tax Assessment Total Assessment is a certain percentage of the fair market value that is determined by local assessors to be the total taxable value of land and additions on the property. | Land | Improvement |
|---|---|---|---|---|
| 2025 | $6,299 | $538,056 | $246,059 | $291,997 |
| 2024 | $6,299 | $527,507 | $241,235 | $286,272 |
| 2023 | $6,279 | $517,164 | $236,505 | $280,659 |
| 2022 | $6,255 | $507,024 | $231,868 | $275,156 |
| 2021 | $6,165 | $497,083 | $227,322 | $269,761 |
| 2020 | $6,059 | $491,987 | $224,992 | $266,995 |
| 2019 | $5,992 | $482,341 | $220,581 | $261,760 |
| 2018 | $5,694 | $472,884 | $216,256 | $256,628 |
| 2017 | $5,621 | $463,613 | $212,016 | $251,597 |
| 2016 | $5,393 | $454,523 | $207,859 | $246,664 |
| 2015 | $5,339 | $447,696 | $204,737 | $242,959 |
| 2014 | $5,191 | $438,927 | $200,727 | $238,200 |
Source: Public Records
Map
Nearby Homes
- 215 Silvera St
- 175 Barker St
- 527 Maple Ave
- 513 Glenmoor Cir
- 170 Marylinn Dr
- 102 Marylinn Dr
- 1008 N Abbott Ave
- 1087 N Abbott Ave
- 7280 Marylinn Dr
- 0 Railroad Ave
- 50 Serra Way
- 295 Rio Verde Place Unit 4
- 353 San Miguel Ct Unit 2
- 1200 N Abbott Ave Unit 200
- 853 Erie Cir
- 650 Folsom Cir
- 690 Claridad Loop Unit 11E
- 1279 Milkweed St
- 969 Mente Linda Loop Unit 6G
- 1357 California Cir
Your Personal Tour Guide
Ask me questions while you tour the home.