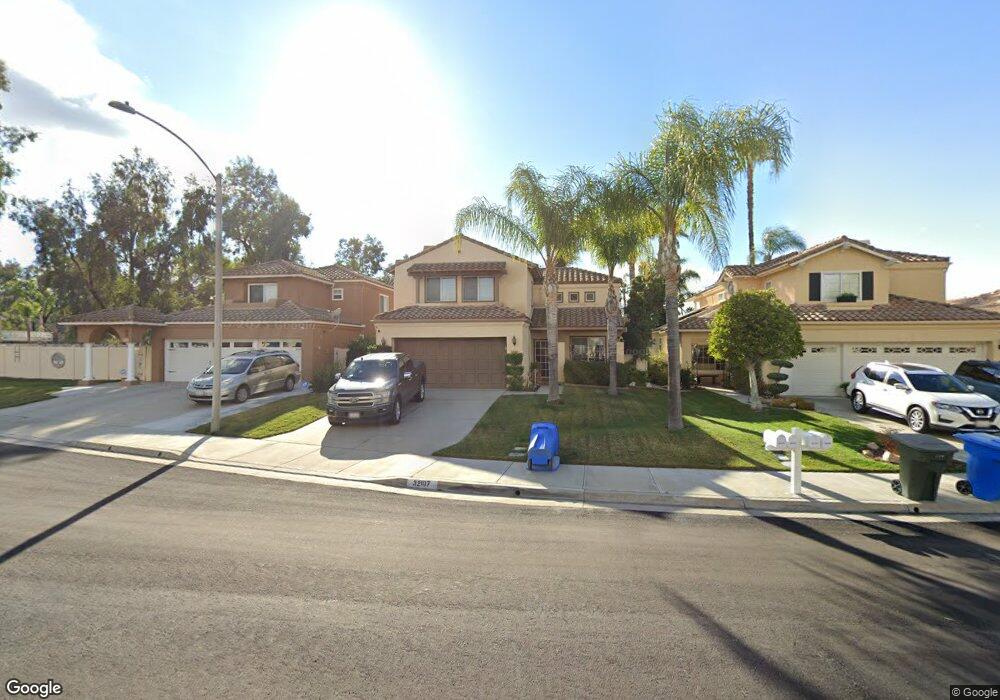
32107 Corte Soledad Temecula, CA 92592
Margarita Village-Temeku Hills NeighborhoodEstimated Value: $647,683 - $699,000
3
Beds
3
Baths
1,714
Sq Ft
$397/Sq Ft
Est. Value
About This Home
This home is located at 32107 Corte Soledad, Temecula, CA 92592 and is currently estimated at $681,171, approximately $397 per square foot. 32107 Corte Soledad is a home located in Riverside County with nearby schools including Vintage Hills Elementary School, Temecula Middle School, and Temecula Valley High School.
Ownership History
Date
Name
Owned For
Owner Type
Purchase Details
Closed on
Apr 30, 1998
Sold by
Va
Bought by
Baine Roderick R and Baine Cynthia S
Current Estimated Value
Home Financials for this Owner
Home Financials are based on the most recent Mortgage that was taken out on this home.
Original Mortgage
$152,027
Outstanding Balance
$29,602
Interest Rate
7.06%
Mortgage Type
Seller Take Back
Estimated Equity
$651,569
Purchase Details
Closed on
Jun 2, 1997
Sold by
Countrywide Home Loans Inc
Bought by
Va
Purchase Details
Closed on
May 8, 1997
Sold by
Solberg Scott and Solberg Carrie
Bought by
Countrywide Home Loans In and Countrywide Funding Corp
Purchase Details
Closed on
Jun 27, 1995
Sold by
Rothschild Richard L and Rothschild Linda J
Bought by
Solberg Scott and Solberg Carrie
Home Financials for this Owner
Home Financials are based on the most recent Mortgage that was taken out on this home.
Original Mortgage
$132,600
Interest Rate
7.38%
Mortgage Type
Assumption
Create a Home Valuation Report for This Property
The Home Valuation Report is an in-depth analysis detailing your home's value as well as a comparison with similar homes in the area
Home Values in the Area
Average Home Value in this Area
Purchase History
| Date | Buyer | Sale Price | Title Company |
|---|---|---|---|
| Baine Roderick R | $158,000 | Orange Coast Title | |
| Va | -- | -- | |
| Countrywide Home Loans In | $110,237 | -- | |
| Solberg Scott | $130,000 | First American Title Ins Co |
Source: Public Records
Mortgage History
| Date | Status | Borrower | Loan Amount |
|---|---|---|---|
| Open | Baine Roderick R | $152,027 | |
| Previous Owner | Solberg Scott | $132,600 |
Source: Public Records
Tax History
| Year | Tax Paid | Tax Assessment Tax Assessment Total Assessment is a certain percentage of the fair market value that is determined by local assessors to be the total taxable value of land and additions on the property. | Land | Improvement |
|---|---|---|---|---|
| 2025 | $3,234 | $251,928 | $55,864 | $196,064 |
| 2023 | $3,234 | $242,147 | $53,696 | $188,451 |
| 2022 | $3,128 | $237,400 | $52,644 | $184,756 |
| 2021 | $3,059 | $232,746 | $51,612 | $181,134 |
| 2020 | $3,024 | $230,360 | $51,083 | $179,277 |
| 2019 | $2,979 | $225,844 | $50,082 | $175,762 |
| 2018 | $2,917 | $221,416 | $49,101 | $172,315 |
| 2017 | $2,864 | $217,076 | $48,139 | $168,937 |
| 2016 | $2,998 | $212,821 | $47,196 | $165,625 |
| 2015 | $3,000 | $209,626 | $46,488 | $163,138 |
| 2014 | $3,062 | $205,522 | $45,578 | $159,944 |
Source: Public Records
Map
Nearby Homes
- 31874 Camino Marea
- 32249 Chemin Laurent
- 31903 Vineyard Ave
- 32147 Corte Florecita
- 32377 Corte Santa Catalina
- 41776 Via Balderama
- 32284 Placer Belair
- 32191 Placer Belair
- 32202 Placer Belair
- 31772 Corte Rosario
- 32130 Corte Parado
- 41657 Cypress Point Way
- 41686 Monterey Place
- 38100 Pauba Rd
- 41309 Avenida Biona
- 41087 Promenade Chardonnay Hills
- 41950 Delmonte St
- 41574 Eagle Point Way
- 41606 Slice Way
- 31444 Pennant Ct
- 32101 Corte Soledad
- 32119 Corte Soledad
- 32095 Corte Soledad
- 41580 Corte Amalia
- 41570 Corte Amalia
- 41590 Corte Amalia
- 41560 Corte Amalia
- 32106 Corte Soledad
- 32112 Corte Soledad
- 32100 Corte Soledad
- 41629 Corte Balboa
- 41574 Corte Amalia
- 32118 Corte Soledad
- 32124 Corte Soledad
- 32130 Corte Soledad
- 32094 Corte Soledad
- 32070 Corte Soledad
- 32076 Corte Soledad
- 32064 Corte Soledad
Your Personal Tour Guide
Ask me questions while you tour the home.