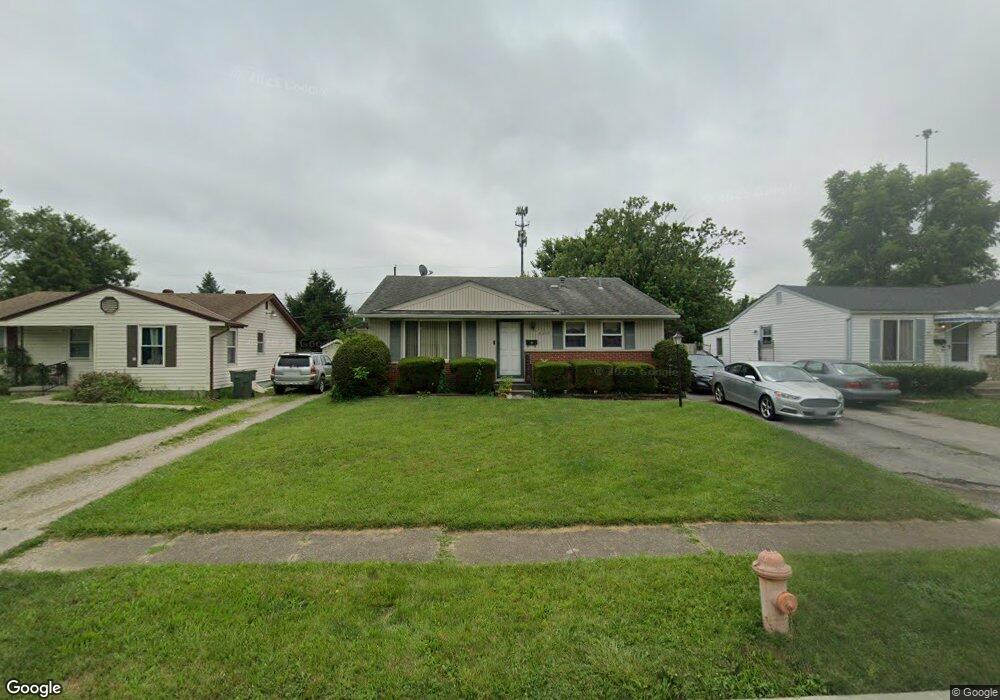
3215 Barnett Ct S Columbus, OH 43227
Linwood NeighborhoodEstimated Value: $170,678 - $204,000
3
Beds
2
Baths
896
Sq Ft
$216/Sq Ft
Est. Value
About This Home
This home is located at 3215 Barnett Ct S, Columbus, OH 43227 and is currently estimated at $193,420, approximately $215 per square foot. 3215 Barnett Ct S is a home located in Franklin County with nearby schools including Scottwood Elementary School, Johnson Park Middle School, and Walnut Ridge High School.
Ownership History
Date
Name
Owned For
Owner Type
Purchase Details
Closed on
Feb 7, 2003
Sold by
Mccreary Angela
Bought by
Mccreary Angela and Saunders Senie Ann
Current Estimated Value
Purchase Details
Closed on
Aug 12, 2002
Sold by
Saunders Senie A
Bought by
Mccreary Angela
Purchase Details
Closed on
May 1, 2000
Sold by
Saunders Lisa A
Bought by
Saunders Senie Ann
Home Financials for this Owner
Home Financials are based on the most recent Mortgage that was taken out on this home.
Original Mortgage
$61,500
Interest Rate
8.18%
Purchase Details
Closed on
Oct 17, 1986
Bought by
Saunders Senie A and Saunders Lisa A
Create a Home Valuation Report for This Property
The Home Valuation Report is an in-depth analysis detailing your home's value as well as a comparison with similar homes in the area
Home Values in the Area
Average Home Value in this Area
Purchase History
| Date | Buyer | Sale Price | Title Company |
|---|---|---|---|
| Mccreary Angela | -- | -- | |
| Mccreary Angela | -- | Mortgage Information Service | |
| Saunders Senie Ann | -- | Mortgage Information Service | |
| Saunders Senie A | $46,900 | -- |
Source: Public Records
Mortgage History
| Date | Status | Borrower | Loan Amount |
|---|---|---|---|
| Previous Owner | Saunders Senie Ann | $61,500 |
Source: Public Records
Tax History Compared to Growth
Tax History
| Year | Tax Paid | Tax Assessment Tax Assessment Total Assessment is a certain percentage of the fair market value that is determined by local assessors to be the total taxable value of land and additions on the property. | Land | Improvement |
|---|---|---|---|---|
| 2024 | $2,060 | $45,890 | $13,200 | $32,690 |
| 2023 | $2,033 | $45,885 | $13,195 | $32,690 |
| 2022 | $1,494 | $28,810 | $7,000 | $21,810 |
| 2021 | $1,497 | $28,810 | $7,000 | $21,810 |
| 2020 | $1,499 | $28,810 | $7,000 | $21,810 |
| 2019 | $1,444 | $23,810 | $5,850 | $17,960 |
| 2018 | $1,323 | $23,810 | $5,850 | $17,960 |
| 2017 | $1,444 | $23,810 | $5,850 | $17,960 |
| 2016 | $1,327 | $20,030 | $4,520 | $15,510 |
| 2015 | $1,204 | $20,030 | $4,520 | $15,510 |
| 2014 | $1,207 | $20,030 | $4,520 | $15,510 |
| 2013 | $661 | $22,225 | $5,005 | $17,220 |
Source: Public Records
Map
Nearby Homes
- 1778 Quigley Rd
- 3325 E Deshler Ave
- 3246 E Deshler Ave
- 1664 Barnett Rd
- 3038 Wadsworth Ct
- 3036 Wadsworth Ct
- 1624 Miltwood Rd
- 1782 Newfield Rd
- 2844 Kingsrowe Ct Unit 27
- 1836 Penfield Ct S
- 2846 Petzinger Rd Unit 70
- 1637 S James Rd
- 2275 Wadsworth Dr
- 2911 Heath Ct
- 2275 Cardston Ct
- 2810 Kingsrowe Ct Unit 13
- 2894 Landon Dr
- 1677 Kenview Rd
- 0 Ravenswood Ct
- 2903 Scottwood Rd
- 3209 Barnett Ct S
- 3221 Barnett Ct S
- 3201 Barnett Ct S
- 3227 Barnett Ct S
- 3197 Barnett Ct S
- 3216 Barnett Ct S
- 1900 Barnett Ct E
- 1892 Barnett Ct W
- 1896 Barnett Ct E
- 1885 Barnett Ct E
- 1884 Barnett Ct W
- 3191 Barnett Ct S
- 1899 Barnett Ct W
- 1890 Barnett Ct E
- 1878 Barnett Ct W
- 1879 Barnett Ct E
- 1901 Kirkbridge Ct
- 1884 Barnett Ct E
- 1903 Kirkbridge Ct
- 1893 Barnett Ct W