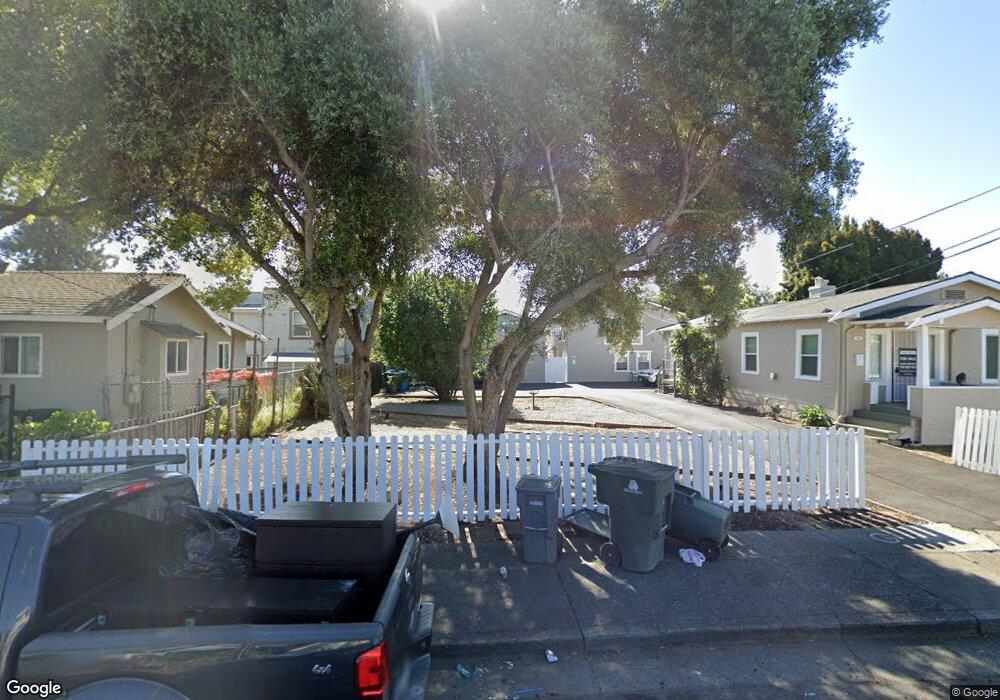
322 Evans Ave Vallejo, CA 94590
West Vallejo NeighborhoodEstimated Value: $98,000 - $457,000
1
Bed
1
Bath
324
Sq Ft
$676/Sq Ft
Est. Value
About This Home
This home is located at 322 Evans Ave, Vallejo, CA 94590 and is currently estimated at $219,009, approximately $675 per square foot. 322 Evans Ave is a home located in Solano County with nearby schools including Grace Patterson Elementary School, Vallejo High School, and Mustard Seed Preschool and Kindergarten.
Ownership History
Date
Name
Owned For
Owner Type
Purchase Details
Closed on
Jan 21, 2022
Sold by
Acuna Frank R
Bought by
Stlb Trust
Current Estimated Value
Purchase Details
Closed on
Sep 27, 2017
Sold by
Acuna Loren R
Bought by
Acuna Frank R
Purchase Details
Closed on
Oct 30, 2014
Sold by
Cervantes Moises and Garcia Alicia
Bought by
Cervantes Moises
Purchase Details
Closed on
Jun 23, 2004
Sold by
Harmeyer Julie M
Bought by
The Julie Harmeyer Living Trust
Purchase Details
Closed on
Oct 6, 1997
Sold by
Allison Georgia
Bought by
Harmeyer Julie M
Home Financials for this Owner
Home Financials are based on the most recent Mortgage that was taken out on this home.
Original Mortgage
$31,800
Interest Rate
7.54%
Purchase Details
Closed on
Mar 28, 1997
Sold by
Stanfield Harry T
Bought by
Allison Georgia
Purchase Details
Closed on
Feb 9, 1996
Sold by
Yee Linda Susan
Bought by
Great Western Bank
Create a Home Valuation Report for This Property
The Home Valuation Report is an in-depth analysis detailing your home's value as well as a comparison with similar homes in the area
Home Values in the Area
Average Home Value in this Area
Purchase History
| Date | Buyer | Sale Price | Title Company |
|---|---|---|---|
| Stlb Trust | -- | None Listed On Document | |
| Acuna Frank R | -- | Old Republic Title Company | |
| Acuna Frank R | $75,000 | Old Republic Title Company | |
| Cervantes Moises | -- | None Available | |
| The Julie Harmeyer Living Trust | -- | -- | |
| Harmeyer Julie M | $40,000 | North American Title Co | |
| Allison Georgia | $14,000 | Chicago Title Co | |
| Great Western Bank | $17,500 | -- |
Source: Public Records
Mortgage History
| Date | Status | Borrower | Loan Amount |
|---|---|---|---|
| Previous Owner | Harmeyer Julie M | $31,800 |
Source: Public Records
Tax History
| Year | Tax Paid | Tax Assessment Tax Assessment Total Assessment is a certain percentage of the fair market value that is determined by local assessors to be the total taxable value of land and additions on the property. | Land | Improvement |
|---|---|---|---|---|
| 2025 | $2,062 | $85,332 | $22,754 | $62,578 |
| 2024 | $2,062 | $83,659 | $22,308 | $61,351 |
| 2023 | $1,890 | $82,020 | $21,871 | $60,149 |
| 2022 | $1,778 | $80,413 | $21,443 | $58,970 |
| 2021 | $1,725 | $78,837 | $21,023 | $57,814 |
| 2020 | $1,719 | $78,030 | $20,808 | $57,222 |
| 2019 | $1,642 | $76,500 | $20,400 | $56,100 |
| 2018 | $1,531 | $75,000 | $20,000 | $55,000 |
| 2017 | $1,233 | $55,035 | $17,887 | $37,148 |
| 2016 | $661 | $53,957 | $17,537 | $36,420 |
| 2015 | $653 | $53,147 | $17,274 | $35,873 |
| 2014 | $645 | $52,107 | $16,936 | $35,171 |
Source: Public Records
Map
Nearby Homes
- 315 Evans Ave
- 321 Benicia Rd
- 227 Evans Ave
- 1434 Beach St
- 401 Central Ave
- 312 Central Ave
- 1425 Gordon St
- 47 Muller St
- 4 Woodrow Ave
- 128 Tuolumne St
- 2019 Georgia St
- 37 14th St
- 214 12th St
- 215 Roney Ave
- 410 San Gabriel Dr Unit 410
- 313 Roney Ave
- 506 Steffan St
- 314 San Marcus Dr
- 242 Phelan Ave
- 139 Laurel St
- 320 Evans Ave
- 324 Evans Ave
- 310 Evans Ave
- 233 Benicia Rd Unit A,B,C
- 233 Benicia Rd
- 243 Benicia Rd
- 229 Benicia Rd
- 300 Evans Ave
- 241 Benicia Rd
- 229 Sperry Ave
- 225 Sperry Ave
- 245 Benicia Rd
- 209 Sperry Ave
- 311 Evans Ave
- 217 Benicia Rd
- 307 Evans Ave
- 201 Sperry Ave
- 301 Evans Ave
- 209 Thomas Ave
- 240 Benicia Rd
Your Personal Tour Guide
Ask me questions while you tour the home.