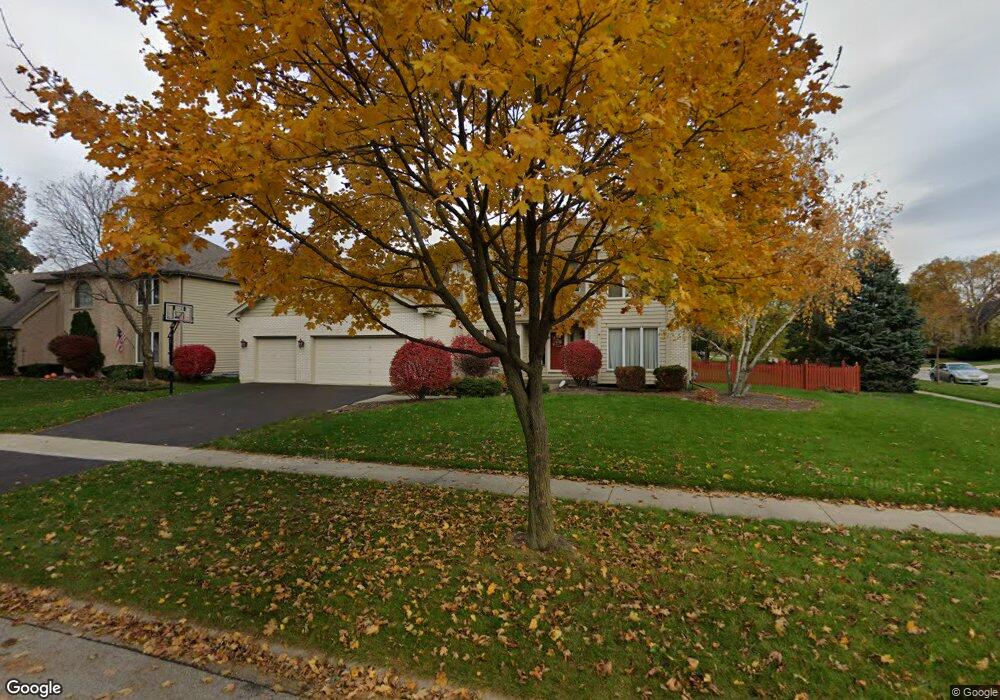
3220 Bennett Dr Unit 1 Naperville, IL 60564
Ashbury NeighborhoodEstimated Value: $707,000 - $793,000
--
Bed
1
Bath
2,863
Sq Ft
$260/Sq Ft
Est. Value
About This Home
This home is located at 3220 Bennett Dr Unit 1, Naperville, IL 60564 and is currently estimated at $744,056, approximately $259 per square foot. 3220 Bennett Dr Unit 1 is a home located in Will County with nearby schools including Ellsworth Elementary School, Gordon Gregory Middle School, and Neuqua Valley High School.
Ownership History
Date
Name
Owned For
Owner Type
Purchase Details
Closed on
Apr 4, 2002
Sold by
Hanson Bryan C and Hanson Julie
Bought by
Mcgee Frank and Mcgee Christine
Current Estimated Value
Home Financials for this Owner
Home Financials are based on the most recent Mortgage that was taken out on this home.
Original Mortgage
$227,500
Interest Rate
6.54%
Purchase Details
Closed on
Jun 30, 1998
Sold by
Spinka Gary L and Spinka Susan
Bought by
Hanson Bryan C and Hanson Julie A
Home Financials for this Owner
Home Financials are based on the most recent Mortgage that was taken out on this home.
Original Mortgage
$244,800
Interest Rate
7.07%
Mortgage Type
Balloon
Create a Home Valuation Report for This Property
The Home Valuation Report is an in-depth analysis detailing your home's value as well as a comparison with similar homes in the area
Home Values in the Area
Average Home Value in this Area
Purchase History
| Date | Buyer | Sale Price | Title Company |
|---|---|---|---|
| Mcgee Frank | $357,500 | Chicago Title Insurance Co | |
| Hanson Bryan C | $306,000 | -- |
Source: Public Records
Mortgage History
| Date | Status | Borrower | Loan Amount |
|---|---|---|---|
| Previous Owner | Mcgee Frank | $227,500 | |
| Previous Owner | Hanson Bryan C | $244,800 |
Source: Public Records
Tax History Compared to Growth
Tax History
| Year | Tax Paid | Tax Assessment Tax Assessment Total Assessment is a certain percentage of the fair market value that is determined by local assessors to be the total taxable value of land and additions on the property. | Land | Improvement |
|---|---|---|---|---|
| 2024 | $13,065 | $207,465 | $65,131 | $142,334 |
| 2023 | $13,065 | $183,273 | $57,536 | $125,737 |
| 2022 | $12,070 | $172,592 | $54,428 | $118,164 |
| 2021 | $11,536 | $164,373 | $51,836 | $112,537 |
| 2020 | $11,317 | $161,769 | $51,015 | $110,754 |
| 2019 | $11,123 | $157,210 | $49,577 | $107,633 |
| 2018 | $11,137 | $154,675 | $48,487 | $106,188 |
| 2017 | $10,967 | $150,682 | $47,235 | $103,447 |
| 2016 | $10,946 | $147,438 | $46,218 | $101,220 |
| 2015 | $10,965 | $141,767 | $44,440 | $97,327 |
| 2014 | $10,965 | $137,119 | $44,440 | $92,679 |
| 2013 | $10,965 | $137,119 | $44,440 | $92,679 |
Source: Public Records
Map
Nearby Homes
- 3004 Bennett Dr
- 3212 Austin Ct
- 3432 Caine Dr
- 2949 Brossman St
- 1116 Hollingswood Ave
- 3616 Eliot Ln
- 2741 Gateshead Dr
- 1123 Thackery Ln
- 3508 Tussell St
- 2636 Salix Cir
- 945 Winners Cup Ct Unit 945
- 1305 Morningstar Ct Unit 1A
- 2207 Sisters Ave
- 1112 Saratoga Ct
- 3816 Rosada Dr
- 28W555 Leverenz Rd
- 1134 Gateshead Dr
- 1804 Princess Cir
- 29W316 Andermann Dr
- 1329 Neskola Ct
- 3216 Bennett Dr
- 1415 Conan Doyle Rd
- 3212 Bennett Dr
- 1411 Conan Doyle Rd
- 1503 Conan Doyle Rd
- 1420 Conan Doyle Rd
- 1408 English Ct
- 1416 Conan Doyle Rd
- 1424 Conan Doyle Rd Unit 1
- 3215 Bennett Dr
- 1412 Conan Doyle Rd
- 1504 Conan Doyle Rd
- 3208 Bennett Dr
- 3211 Bennett Dr
- 1407 Conan Doyle Rd
- 1412 English Ct
- 1404 English Ct
- 1408 Conan Doyle Rd
- 1508 Conan Doyle Rd
- 1419 Keats Ave Unit 1