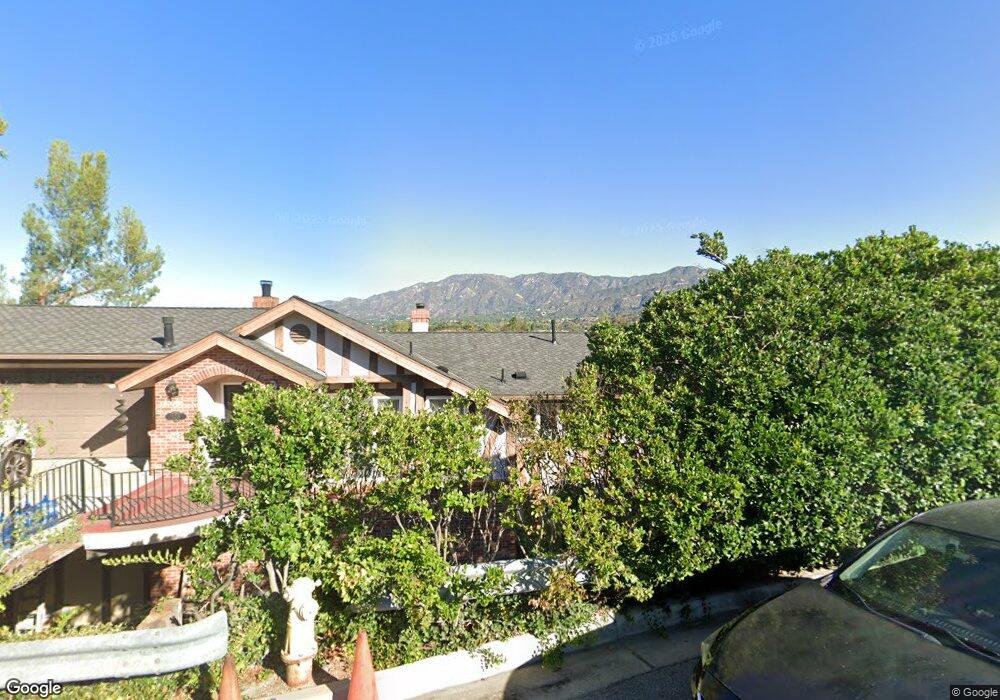
3222 Vickers Dr Glendale, CA 91208
Montecito Park NeighborhoodEstimated Value: $1,354,000 - $1,519,909
2
Beds
2
Baths
1,641
Sq Ft
$859/Sq Ft
Est. Value
About This Home
This home is located at 3222 Vickers Dr, Glendale, CA 91208 and is currently estimated at $1,408,977, approximately $858 per square foot. 3222 Vickers Dr is a home located in Los Angeles County with nearby schools including John C. Fremont Elementary School, Rosemont Middle School, and Crescenta Valley High School.
Ownership History
Date
Name
Owned For
Owner Type
Purchase Details
Closed on
Sep 19, 2019
Sold by
Gonzalez Nicole A and The Engene And Mary Brink Livi
Bought by
Zadourian Armen
Current Estimated Value
Home Financials for this Owner
Home Financials are based on the most recent Mortgage that was taken out on this home.
Original Mortgage
$726,000
Outstanding Balance
$634,608
Interest Rate
3.5%
Mortgage Type
New Conventional
Estimated Equity
$774,370
Purchase Details
Closed on
Sep 9, 2019
Sold by
Babaian Arsineh
Bought by
Zadourian Armen
Home Financials for this Owner
Home Financials are based on the most recent Mortgage that was taken out on this home.
Original Mortgage
$726,000
Outstanding Balance
$634,608
Interest Rate
3.5%
Mortgage Type
New Conventional
Estimated Equity
$774,370
Purchase Details
Closed on
May 11, 1999
Sold by
Brink Eugene R
Bought by
Brink Eugene R and Brink Mary F
Purchase Details
Closed on
Apr 23, 1998
Sold by
Brink Eugene R
Bought by
Brink Eugene R and Brink Mary F
Create a Home Valuation Report for This Property
The Home Valuation Report is an in-depth analysis detailing your home's value as well as a comparison with similar homes in the area
Home Values in the Area
Average Home Value in this Area
Purchase History
| Date | Buyer | Sale Price | Title Company |
|---|---|---|---|
| Zadourian Armen | $930,000 | Equity Title Company | |
| Zadourian Armen | -- | Equity Title Company | |
| Brink Eugene R | -- | -- | |
| Brink Eugene R | -- | -- |
Source: Public Records
Mortgage History
| Date | Status | Borrower | Loan Amount |
|---|---|---|---|
| Open | Zadourian Armen | $726,000 |
Source: Public Records
Tax History
| Year | Tax Paid | Tax Assessment Tax Assessment Total Assessment is a certain percentage of the fair market value that is determined by local assessors to be the total taxable value of land and additions on the property. | Land | Improvement |
|---|---|---|---|---|
| 2025 | $11,107 | $1,017,085 | $813,670 | $203,415 |
| 2024 | $11,107 | $997,143 | $797,716 | $199,427 |
| 2023 | $10,854 | $977,592 | $782,075 | $195,517 |
| 2022 | $10,666 | $958,425 | $766,741 | $191,684 |
| 2021 | $10,485 | $939,633 | $751,707 | $187,926 |
| 2019 | $1,070 | $82,364 | $38,875 | $43,489 |
| 2018 | $994 | $80,750 | $38,113 | $42,637 |
| 2016 | $928 | $77,616 | $36,634 | $40,982 |
| 2015 | $911 | $76,451 | $36,084 | $40,367 |
| 2014 | $920 | $74,955 | $35,378 | $39,577 |
Source: Public Records
Map
Nearby Homes
- 3232 Vickers Dr
- 3226 Menlo Dr
- 2064 Oak Valley Rd
- 3328 N Verdugo Rd
- 0 Bayberry Dr Unit 25567317
- 2950 Oak Glen Rd
- 1881 Alpha Rd Unit 17
- 2940 N Verdugo Rd Unit 305
- 1935 Alpha Rd Unit 337
- 3412 La Crescenta Ave
- 1724 Sombra Dr
- 182 Emburns Dr
- 192 Emburns Dr
- 2 Emburns Dr
- 3629 Sierra Vista Ave
- 1 Pasa Glen Dr
- 2460 Las Positas Rd
- 2 Vista Del Verde Dr
- 6 Vista Del Verde Dr
- 2 Pasa Glen Dr
- 3215 Menlo Dr
- 3220 Vickers Dr
- 3228 Vickers Dr
- 3212 Menlo Dr
- 3230 Vickers Dr
- 3210 Vista Del Mar Dr
- 3210 Menlo Dr
- 3243 Menlo Dr
- 3238 Vickers Dr
- 3220 Menlo Dr
- 3171 El Tovar Dr
- 3240 Menlo Dr
- 3165 El Tovar Dr
- 3218 Vickers Dr
- 3244 Vickers Dr
- 3200 Menlo Dr
- 0 Vista Del Mar Dr
- 3225 Vickers Dr
- 3230 Menlo Dr
- 3219 Vickers Dr
Your Personal Tour Guide
Ask me questions while you tour the home.