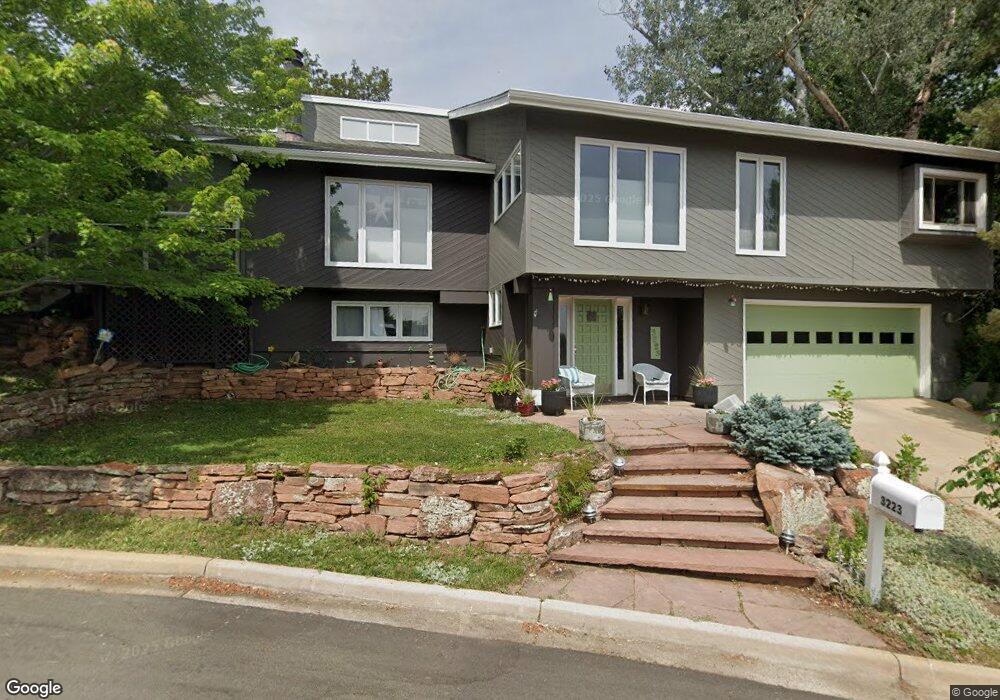
3223 3rd St Boulder, CO 80304
Newlands NeighborhoodEstimated Value: $1,935,735 - $2,482,000
4
Beds
3
Baths
2,213
Sq Ft
$1,041/Sq Ft
Est. Value
About This Home
This home is located at 3223 3rd St, Boulder, CO 80304 and is currently estimated at $2,302,684, approximately $1,040 per square foot. 3223 3rd St is a home located in Boulder County with nearby schools including Foothill Elementary School, Casey Middle School, and Boulder High School.
Ownership History
Date
Name
Owned For
Owner Type
Purchase Details
Closed on
May 19, 2023
Sold by
Medvedich Kiersten M
Bought by
Reiter-Medvedich Family Trust
Current Estimated Value
Purchase Details
Closed on
Jun 25, 1999
Sold by
Mavis Stanly A and Mavis Lynne B
Bought by
Gilbert Erik I
Home Financials for this Owner
Home Financials are based on the most recent Mortgage that was taken out on this home.
Original Mortgage
$350,000
Interest Rate
7.11%
Purchase Details
Closed on
Sep 30, 1994
Sold by
Mccabe Richard L
Bought by
Spectrum Building Enterprises Inc
Purchase Details
Closed on
Jun 2, 1986
Bought by
Gilbert Erik I and Weston Mary J
Purchase Details
Closed on
Mar 28, 1986
Bought by
Gilbert Erik I and Weston Mary J
Purchase Details
Closed on
Feb 9, 1977
Bought by
Gilbert Erik I and Weston Mary J
Create a Home Valuation Report for This Property
The Home Valuation Report is an in-depth analysis detailing your home's value as well as a comparison with similar homes in the area
Home Values in the Area
Average Home Value in this Area
Purchase History
| Date | Buyer | Sale Price | Title Company |
|---|---|---|---|
| Reiter-Medvedich Family Trust | -- | None Listed On Document | |
| Gilbert Erik I | $512,000 | -- | |
| Spectrum Building Enterprises Inc | $30,000 | Land Title | |
| Gilbert Erik I | $197,000 | -- | |
| Gilbert Erik I | -- | -- | |
| Gilbert Erik I | $110,000 | -- |
Source: Public Records
Mortgage History
| Date | Status | Borrower | Loan Amount |
|---|---|---|---|
| Previous Owner | Gilbert Erik I | $350,000 |
Source: Public Records
Tax History
| Year | Tax Paid | Tax Assessment Tax Assessment Total Assessment is a certain percentage of the fair market value that is determined by local assessors to be the total taxable value of land and additions on the property. | Land | Improvement |
|---|---|---|---|---|
| 2025 | $13,405 | $139,206 | $97,625 | $41,581 |
| 2024 | $13,172 | $152,526 | $103,850 | $48,676 |
| 2023 | $13,172 | $152,526 | $107,535 | $48,676 |
| 2022 | $10,617 | $114,327 | $76,269 | $38,058 |
| 2021 | $10,124 | $117,617 | $78,464 | $39,153 |
| 2020 | $10,008 | $114,973 | $68,569 | $46,404 |
| 2019 | $9,855 | $114,973 | $68,569 | $46,404 |
| 2018 | $9,090 | $104,846 | $56,592 | $48,254 |
| 2017 | $8,806 | $115,914 | $62,566 | $53,348 |
| 2016 | $8,524 | $98,473 | $45,929 | $52,544 |
Source: Public Records
Map
Nearby Homes
- 300 Forest Ave
- 3189 5th St
- 503 Hawthorn Ave
- 521 Hawthorn Ave
- 501 Evergreen Ave
- 3033 3rd St
- 440 Japonica Way
- 3015 3rd St
- 640 Iris Ave
- 3421 4th St
- 711 Hawthorn Ave
- 656 Juniper Ave
- 2958 6th St
- 706 Juniper Ave
- 865 Grape Ave Unit X
- 3056 8th St
- 495 S Cedar Brook Rd
- 497 Kalmia Ave
- 503 Kalmia Ave
- 1023 Forest Ave
Your Personal Tour Guide
Ask me questions while you tour the home.