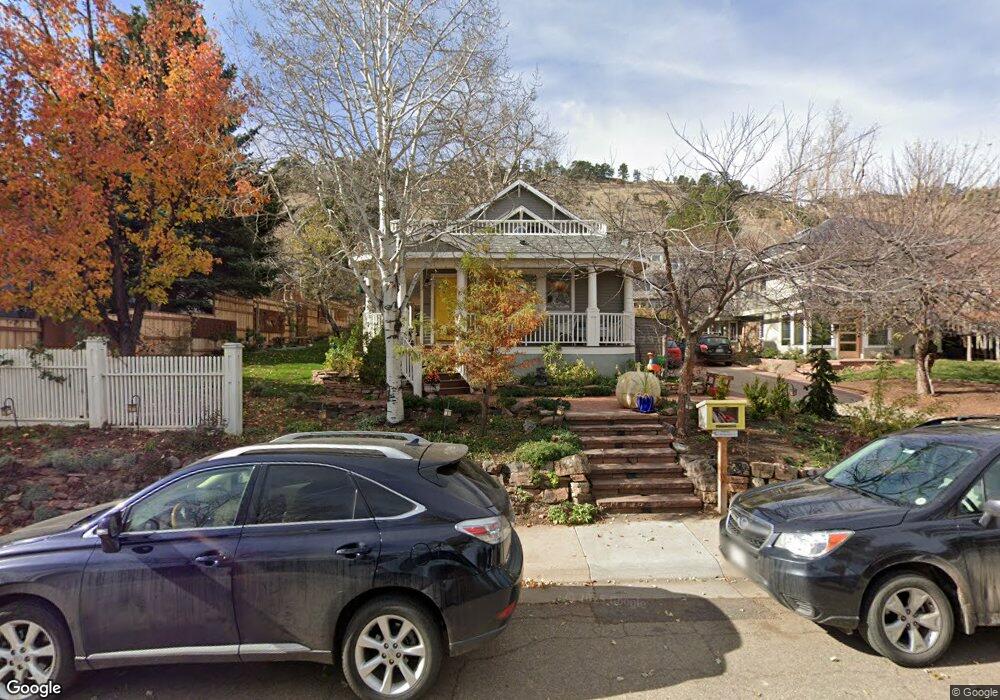
3223 4th St Boulder, CO 80304
Newlands NeighborhoodEstimated Value: $1,405,000 - $1,875,000
3
Beds
3
Baths
1,480
Sq Ft
$1,090/Sq Ft
Est. Value
About This Home
This home is located at 3223 4th St, Boulder, CO 80304 and is currently estimated at $1,613,195, approximately $1,089 per square foot. 3223 4th St is a home located in Boulder County with nearby schools including Foothill Elementary School, Casey Middle School, and Boulder High School.
Ownership History
Date
Name
Owned For
Owner Type
Purchase Details
Closed on
Dec 12, 2019
Sold by
Smollen Lindasue
Bought by
Reiter Devin and Medvedich Kiersten
Current Estimated Value
Purchase Details
Closed on
Jul 18, 2004
Sold by
Rockwell David L
Bought by
Smollen Lindasue
Purchase Details
Closed on
Dec 10, 1986
Bought by
Smollen Lindasue
Purchase Details
Closed on
Apr 8, 1983
Bought by
Smollen Lindasue
Purchase Details
Closed on
Sep 24, 1981
Bought by
Smollen Lindasue
Create a Home Valuation Report for This Property
The Home Valuation Report is an in-depth analysis detailing your home's value as well as a comparison with similar homes in the area
Home Values in the Area
Average Home Value in this Area
Purchase History
| Date | Buyer | Sale Price | Title Company |
|---|---|---|---|
| Reiter Devin | -- | None Available | |
| Smollen Lindasue | -- | -- | |
| Smollen Lindasue | $155,000 | -- | |
| Smollen Lindasue | -- | -- | |
| Smollen Lindasue | $135,000 | -- |
Source: Public Records
Tax History
| Year | Tax Paid | Tax Assessment Tax Assessment Total Assessment is a certain percentage of the fair market value that is determined by local assessors to be the total taxable value of land and additions on the property. | Land | Improvement |
|---|---|---|---|---|
| 2025 | $9,922 | $109,181 | $95,231 | $13,950 |
| 2024 | $9,922 | $109,181 | $95,231 | $13,950 |
| 2023 | $9,749 | $119,595 | $105,545 | $17,735 |
| 2022 | $7,820 | $91,157 | $75,797 | $15,360 |
| 2021 | $7,457 | $93,780 | $77,978 | $15,802 |
| 2020 | $6,760 | $84,807 | $67,854 | $16,953 |
| 2019 | $7,269 | $84,807 | $67,854 | $16,953 |
| 2018 | $6,313 | $72,814 | $55,440 | $17,374 |
| 2017 | $6,115 | $80,499 | $61,292 | $19,207 |
| 2016 | $5,998 | $69,292 | $46,009 | $23,283 |
| 2015 | $5,680 | $57,161 | $31,044 | $26,117 |
| 2014 | $4,806 | $57,161 | $31,044 | $26,117 |
Source: Public Records
Map
Nearby Homes
- 300 Forest Ave
- 3189 5th St
- 501 Evergreen Ave
- 3033 3rd St
- 503 Hawthorn Ave
- 3015 3rd St
- 521 Hawthorn Ave
- 440 Japonica Way
- 640 Iris Ave
- 2958 6th St
- 711 Hawthorn Ave
- 3421 4th St
- 656 Juniper Ave
- 865 Grape Ave Unit X
- 3056 8th St
- 706 Juniper Ave
- 495 S Cedar Brook Rd
- 1023 Forest Ave
- 3135 11th St
- 497 Kalmia Ave
Your Personal Tour Guide
Ask me questions while you tour the home.