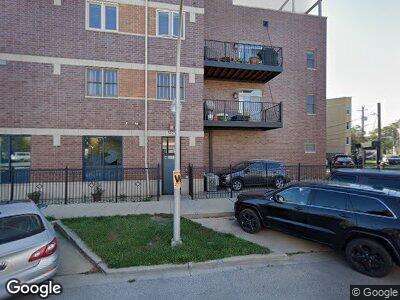
3223 N Francisco Ave Unit AVE2A Chicago, IL 60618
Avondale NeighborhoodEstimated Value: $498,000 - $546,000
3
Beds
2
Baths
1,600
Sq Ft
$326/Sq Ft
Est. Value
About This Home
This home is located at 3223 N Francisco Ave Unit AVE2A, Chicago, IL 60618 and is currently estimated at $521,702, approximately $326 per square foot. 3223 N Francisco Ave Unit AVE2A is a home located in Cook County with nearby schools including Linne Elementary School, Schurz High School, and Acero Charter - Carlos Fuentes Cmpus.
Ownership History
Date
Name
Owned For
Owner Type
Purchase Details
Closed on
May 29, 2020
Sold by
Chard Adam
Bought by
Chard Adam and Chard Alison P
Current Estimated Value
Home Financials for this Owner
Home Financials are based on the most recent Mortgage that was taken out on this home.
Original Mortgage
$276,270
Outstanding Balance
$249,902
Interest Rate
3.25%
Mortgage Type
New Conventional
Estimated Equity
$265,067
Purchase Details
Closed on
Jul 15, 2015
Sold by
Flynn David and Flynn Megan
Bought by
Chard Adam
Home Financials for this Owner
Home Financials are based on the most recent Mortgage that was taken out on this home.
Original Mortgage
$304,000
Interest Rate
4.75%
Mortgage Type
New Conventional
Purchase Details
Closed on
May 22, 2008
Sold by
Bloomhill Homes Inc
Bought by
Flynn David and Flynn Megan
Home Financials for this Owner
Home Financials are based on the most recent Mortgage that was taken out on this home.
Original Mortgage
$360,050
Interest Rate
5.93%
Mortgage Type
Unknown
Create a Home Valuation Report for This Property
The Home Valuation Report is an in-depth analysis detailing your home's value as well as a comparison with similar homes in the area
Home Values in the Area
Average Home Value in this Area
Purchase History
| Date | Buyer | Sale Price | Title Company |
|---|---|---|---|
| Chard Adam | -- | Accommodation | |
| Chard Adam | $380,000 | Cti | |
| Flynn David | $379,000 | Multiple |
Source: Public Records
Mortgage History
| Date | Status | Borrower | Loan Amount |
|---|---|---|---|
| Open | Chard Adam | $276,270 | |
| Previous Owner | Chard Adam | $304,000 | |
| Previous Owner | Flynn David | $360,050 |
Source: Public Records
Tax History Compared to Growth
Tax History
| Year | Tax Paid | Tax Assessment Tax Assessment Total Assessment is a certain percentage of the fair market value that is determined by local assessors to be the total taxable value of land and additions on the property. | Land | Improvement |
|---|---|---|---|---|
| 2024 | $7,095 | $42,158 | $5,469 | $36,689 |
| 2023 | $7,095 | $37,800 | $4,840 | $32,960 |
| 2022 | $7,095 | $37,800 | $4,840 | $32,960 |
| 2021 | $6,954 | $37,798 | $4,839 | $32,959 |
| 2020 | $6,350 | $31,505 | $1,940 | $29,565 |
| 2019 | $6,382 | $35,081 | $1,940 | $33,141 |
| 2018 | $6,251 | $35,081 | $1,940 | $33,141 |
| 2017 | $5,677 | $29,748 | $1,764 | $27,984 |
| 2016 | $5,458 | $29,748 | $1,764 | $27,984 |
| 2015 | $4,971 | $29,748 | $1,764 | $27,984 |
| 2014 | $3,292 | $20,312 | $1,587 | $18,725 |
| 2013 | $3,216 | $20,312 | $1,587 | $18,725 |
Source: Public Records
Map
Nearby Homes
- 3215 N Francisco Ave Unit GS
- 3240 N California Ave Unit 1N
- 2826 W Fletcher St Unit 2
- 2955 W Belmont Ave
- 2732 W Belmont Ave
- 3320 N California Ave
- 3124 N Sacramento Ave
- 3104 N Sacramento Ave
- 3046 W Belmont Ave
- 2639 W Belmont Ave Unit 4
- 3110 W Belmont Ave
- 2818 W Wellington Ave
- 3344 N Albany Ave
- 3122 W Belmont Ave
- 3012 W Newport Ave
- 3447 N Whipple St
- 3401 N Troy St
- 2928 N Sacramento Ave
- 3100 N Albany Ave
- 3450 N Troy St
- 3223 N Francisco Ave Unit 4A
- 3223 N Francisco Ave Unit 2C
- 3223 N Francisco Ave Unit 3B
- 3223 N Francisco Ave Unit AVE2A
- 3223 N Francisco Ave Unit 4B
- 3223 N Francisco Ave Unit 4A
- 3223 N Francisco Ave Unit 3C
- 3223 N Francisco Ave Unit 3A
- 3223 N Francisco Ave Unit 2A
- 3244 N Francisco Ave Unit 4B
- 3244 N Francisco Ave Unit 3C
- 3242 N Francisco Ave Unit 3A
- 3244 N Francisco Ave Unit 2B
- 3238 N Elston Ave
- 3236 N Elston Ave Unit 1
- 3236 N Elston Ave Unit 32361
- 3236 N Elston Ave Unit G
- 3236 N Elston Ave Unit 3
- 3217 N Francisco Ave Unit 3E
- 3217 N Francisco Ave Unit 3217